§18 CRYPTO Terminal¶
OVERVIEW¶
The Crypto page is a workspace for the ten biggest coins. Pick a pair, watch its live price, and study it on the chart. Around the chart you get the top 50 coins, the market mood, and a strip of money-flow signals such as stablecoin supply, bitcoin funding rates and spot ETF flows. Crypto trades all day and night, so the page is live at any hour.
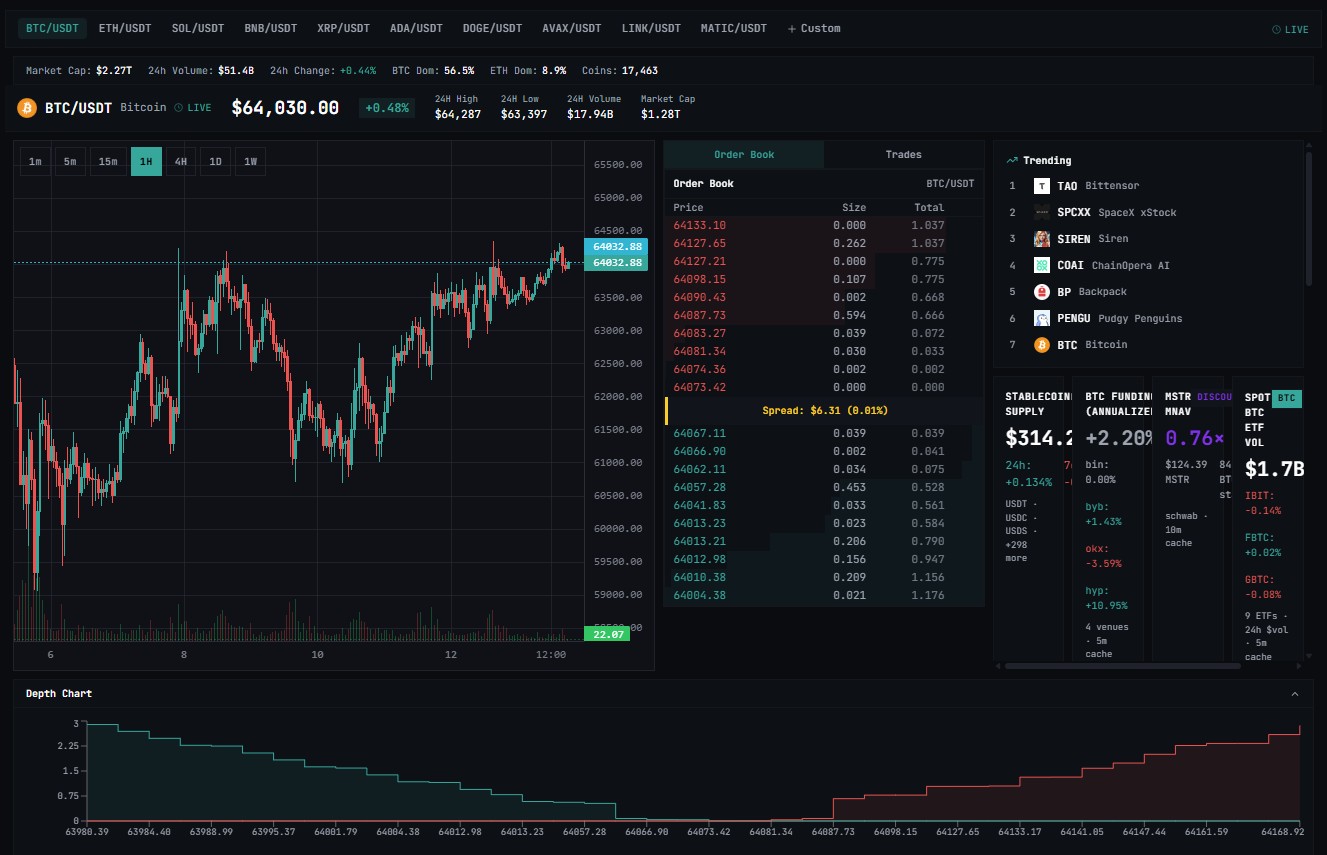
Path: /crypto
Sidebar group: §MACRO
Note
A LIVE badge means the price feed is flowing. DELAYED means the feed dropped and the page is showing a cached price. If the order book is blurred with an upgrade box, it needs Pro. Custom pairs are saved in this browser and need Terminal.
FEATURES¶
Tier Access¶
| Feature | Free | Pro | Terminal |
|---|---|---|---|
| Default pairs (BTC, ETH, SOL subset) | ✓ | ✓ | ✓ |
| Nine default pairs (BTC, ETH, SOL, BNB, XRP, ADA, AVAX, LINK, MATIC) | ✓ | ✓ | ✓ |
| DOGE pair | — | ✓ | ✓ |
| Candle chart | ✓ | ✓ | ✓ |
| Indicators and drawings | ✓ | ✓ | ✓ |
| Trending coins | ✓ | ✓ | ✓ |
| Fear & Greed gauge | ✓ | ✓ | ✓ |
| Market overview (top 50) | ✓ | ✓ | ✓ |
| Order book ladder | — | ✓ | ✓ |
| Depth chart | — | ✓ | ✓ |
| Trades feed | — | — | ✓ |
| Custom pair input | — | — | ✓ |
| Price alerts | ✓ (signed in) | ✓ (signed in) | ✓ (signed in) |
Order Book Fields¶
| Field | Meaning |
|---|---|
| Price | Order book level |
| Size | Quantity at that level |
| Total | Cumulative quantity from best price out to this level |
| Bid (green) | Buy orders sitting below spot |
| Ask (red) | Sell orders sitting above spot |
Note
The order book shows the 10 best buy and 10 best sell prices. On a phone, Pro accounts see the best bid, best ask and spread in one strip instead of the full ladder. The order book panel only shows on wide screens.
Global Stats Fields¶
| Metric | Meaning |
|---|---|
| Total market cap | Combined market cap of all tracked coins, in USD |
| 24h volume | Total traded volume across the market over the last 24 hours |
| BTC dominance | BTC share of total market cap |
| ETH dominance | ETH share of total market cap |
| Market cap change 24h | Percentage change in total market cap over 24 hours |
| Active cryptocurrencies | Count of coins currently tracked |
Note
24h volume and market cap figures are aggregates across all listed exchanges, not a single venue.
Fear & Greed Index¶
A composite sentiment index built from volatility, market momentum, social media activity, dominance data, search trends, and survey data.
| Range | Signal |
|---|---|
| 0–20 | Extreme fear |
| 21–49 | Fear |
| 50–74 | Greed |
| 75–100 | Extreme greed |
A 30-day history is rendered in the gauge sparkline.
HOW TO USE¶
- Open
Cryptofrom the Macro group in the sidebar. - On a computer, click a pair in the row at the top, such as ETH/USDT. On a phone, use the drop-down list. The price header, chart and news all switch to that coin. Your last pair, timeframe and chart type are remembered on this device, and on your account when you are signed in.
- Use the box at the top left of the chart to choose a timeframe, from a few seconds up to one week. The seconds options appear for coins that support them. Click Candles to change the chart type.
- Click INDICATORS to add studies — click one to turn it on and again to turn it off. Click COMPARE to lay another coin over the chart. Pick a drawing tool from the strip on the left edge to mark trend lines, ranges and levels.
- To set a price alert, click the bell at the top right of the chart. Choose Price Above, Price Below, % Change or Volume Above, type the number and confirm. You need to be signed in. Manage alerts on the Alerts page.
- Read the Order Book panel to the right of the chart (Pro+) — 10 best buy and 10 best sell prices, bids in green, asks in red. The Trades tab streams recent trades (Terminal only). Below the chart, Pro and Terminal also get a depth chart of the same book.
- Scroll to Market Overview, Top 50 and click a row to load that coin. Check the top strip for total market cap, 24-hour volume and bitcoin and ether dominance.
- Read the Fear & Greed gauge and Trending list beside each other below the chart.
- Read the macro strip for stablecoin supply, bitcoin funding rates, MicroStrategy's premium to its bitcoin, and spot ETF flows. Scroll on for Public Company Holdings and news for the coin you have selected.
- To add a custom pair (Terminal), click + Custom, type the symbol (e.g.
DOT/USDTor justDOT), then press Enter. The pair is saved in this browser.
Tip
Watch BTC dominance alongside spot prices. Rising dominance paired with falling alt prices is the classic "alts bleeding to BTC" signal — a useful filter before entering alt positions.
Tip
Use the depth chart before sizing into a thin alt. If cumulative depth on the bid or ask is thinner than your intended size, your order will move the market. Size down or work the order in tranches.
Tip
Cross-check the Fear & Greed index against your own conviction. Historically, readings below 20 have marked local bottoms; readings above 80 have marked local tops. Neither is a trigger on its own — use them as a contrarian pressure gauge.
Tip
Watch the public-company holdings panel and macro strip as macro signals. Changes in stablecoin supply, bitcoin funding rates, ETF flows, or MicroStrategy treasury balances represent real capital flows into or out of the asset.
Default Pairs¶
BTC/USDT ETH/USDT SOL/USDT BNB/USDT XRP/USDT ADA/USDT DOGE/USDT AVAX/USDT LINK/USDT MATIC/USDT
KEYBOARD SHORTCUTS¶
| Shortcut | Action |
|---|---|
| — | No keyboard shortcut assigned. Open via the §MACRO group in the sidebar or navigate directly to /crypto. |