§16 INSIDER_ACTIVITY¶
OVERVIEW¶
Company insiders must report their stock trades to the SEC on a Form 4, usually within two business days. Insider activity puts those filings in one place. Buying is the more useful signal, because insiders sell for many reasons but usually buy for one. A cluster of several insiders buying the same stock is the strongest version.
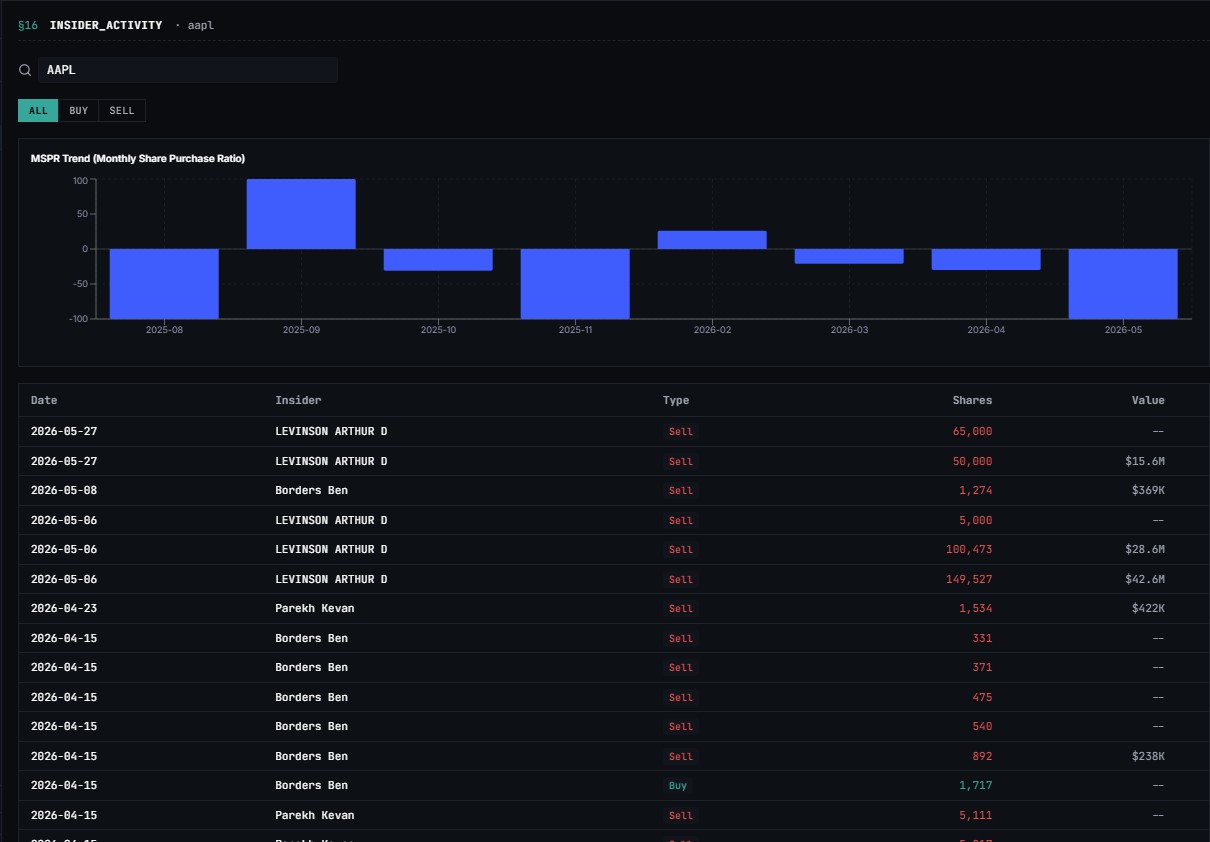
THE INSIDER ACTIVITY FEED¶
HOW TO READ THE INSIDER FEED¶
- Click Insider Activity in the sidebar. With no ticker entered, you see the latest biggest insider trades across all companies.
- Click ALL, BUY or SELL above the table to narrow it. The table title changes to match, for example LATEST BIGGEST INSIDER BUYS.
- Scan the rows for the insider's name and role, the value of the trade and how much it changed their holding.
- Look for the CLUSTER badge. It means two or more insiders bought the same ticker, and is the highest-signal flag on the page.
The feed needs a free account. Logged-out visitors see a sign-up prompt in its place.
HOW TO SET THE MINIMUM VALUE¶
- Open the MIN menu next to the filter buttons.
- Choose $50K, $100K, $500K, $1M or $5M. The default is $50K.
- The feed reloads with only trades at or above that size.
Raise the minimum to cut small routine trades and see the large ones.
HOW TO LOOK UP ONE TICKER¶
- Type a ticker in Enter ticker at the top of the page.
- Pick it from the list. You get a monthly chart of insider buying against selling, and a table of that company's Form 4 transactions with date, insider, buy or sell and share count.
- ALL, BUY and SELL filter the table. Click a row to open the filing at the SEC.
Ticker lookups work without an account. The same list is in the Insider Activity tab on Research, where free accounts see the latest 10 rows.
GOOD TO KNOW¶
- Buy or sell is worked out from the change in shares. An option exercise that adds shares can look like a buy, so check the filing when the number matters.
- Planned sales set up in advance look the same as ones chosen on the day. The filing text says which it was.
- Filings arrive one to three business days after the trade, and the feed is quiet outside weekday market hours.
- To read the full form, open the ticker's filings on SEC filings.
IF SOMETHING DOESN'T WORK¶
The feed asks you to sign up: the market-wide feed needs a free account. Ticker lookups do not.
No rows for a ticker: small caps, recent listings and foreign companies often have little or no Form 4 history.
The feed looks old: it can show the last session's trades outside market hours. A note at the top shows when it was last updated.
ACCESS¶
| Property | Value |
|---|---|
| Path | /insider |
| Direct jump | /insider?symbol=<TICKER> |
| Keyboard shortcut | None — accessible from the sidebar |
| Tier | Free — no cap applied on this page |
Note
The Research dossier caps free users at the last 10 insider transactions. This dedicated page does not apply that cap. The insider feed returns the same depth for all callers.
FEATURES¶
Transaction Table¶
Every Form 4 on record for the searched ticker, filtered by ALL, BUY, or SELL.
| Column | Description |
|---|---|
| DATE | Transaction date, or filing date when transaction date is missing |
| INSIDER | Name of the filing officer or director |
| TYPE | Buy (green) or Sell (red) — derived from the sign of the share change; hidden below 640 px |
| SHARES | Absolute share count of the transaction |
| VALUE | Number of shares × share price |
MSPR Chart¶
Monthly bars showing (buys − sells) / total × 100, bucketed by calendar month. Range is −100 to +100. All bars use a single fill color (#2962ff) regardless of sign — direction above or below zero carries the sentiment.
RELATED¶
- Research — the per-ticker insider tab lives there too
- Filings — the full SEC feed (8-Ks, 10-Qs, S-1s)
KEYBOARD SHORTCUTS¶
| Action | Shortcut |
|---|---|
| Run search | Enter (from ticker input) |
Note
No dedicated keyboard shortcut opens this page. Use the sidebar to navigate to /insider.
LIMITS¶
| Limitation | Detail |
|---|---|
| Coverage depth | Varies by ticker. Foreign issuers and recent IPOs often return 90 days or less of history |
| Transaction classification | change > 0 → BUY, change < 0 → SELL. Option exercises resulting in a net share increase classify as buys; they are not tagged separately |
| 10b5-1 detection | Scheduled sells are not flagged — they appear identical to discretionary sells. Check Form 4 footnotes via the row deep-link |
| MSPR granularity | Monthly only — no weekly or daily view. Months with zero transactions render as zero bars, not gaps |
| Alerting | Form 4 filings do not trigger Tapeboard alerts. Use SEC.gov RSS for filing notifications |
| SHARES column | Represents transaction shares, not post-transaction holdings |
| Data freshness | Filings arrive one to three business days after the trade. The feed is quiet outside weekday market hours |
| Cluster-buy detection | Surfaced as a CLUSTER badge when two or more insiders buy the same ticker |