§10 ECONOMIC_DASHBOARD¶
OVERVIEW¶
The Economic page shows the numbers that set the mood for the whole market: interest rates, inflation, growth, jobs and housing. Each number is a card with its latest reading and a small trend. Above the cards you get the Treasury yield curve, the coming releases and a simple recession check. The data comes from official Federal Reserve data, so most cards update daily, weekly or monthly, not by the second.
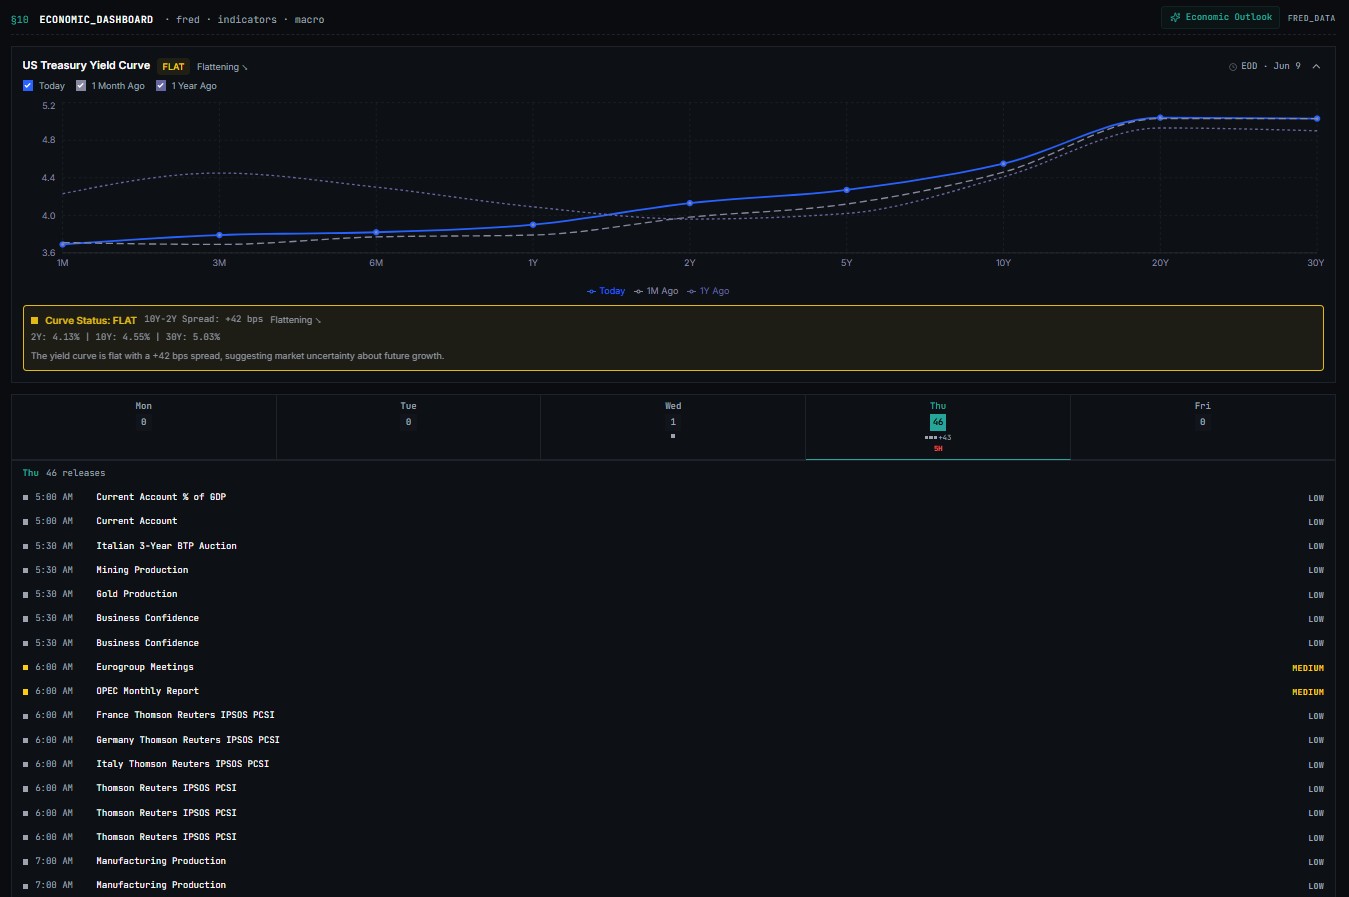
Path: /economic
Sidebar group: §DATA
Keyboard shortcut: None
| Tier | Access |
|---|---|
| Free | 8 curated series (FEDFUNDS, CPIAUCSL, GDP, UNRATE, DGS10, DGS2, MORTGAGE30US, HOUST); no expanded charts; no AI |
| Pro | All 25+ series; expanded chart drill-downs; AI Economic Explain (15 requests/day) |
| Terminal | Everything in Pro; AI Economic Summary auto-loads at page top; no AI caps |
FEATURES¶
Indicator Grid¶
Five categories organize the full series stack. Each card shows latest value, period-over-period change, and a 10-observation sparkline.
| Category | Series |
|---|---|
| Interest Rates & Fed Policy | FEDFUNDS, DGS10, DGS2, DGS30, T10Y2Y, T10Y3M |
| Inflation | CPIAUCSL (Headline CPI), CPILFESL (Core CPI), PCEPI |
| Growth & Employment | GDPC1, A191RL1Q225SBEA (GDP growth %), UNRATE, PAYEMS (NFP), ICSA (Initial Claims) |
| Consumer & Housing | UMCSENT, RSAFS, HOUST, MORTGAGE30US, MORTGAGE15US, CSUSHPISA (Case-Shiller) |
| Market & Liquidity | M2SL, DTWEXBGS (Trade-Weighted Dollar), SP500, VIXCLS |
What's on it¶
- Yield curve — full US Treasury curve with the 10s/2s spread called out
- Inflation — CPI, Core CPI, PCE deflator (the Fed's own target)
- Labor — NFP, jobless claims, JOLTS
- Growth — GDP, retail sales, IP
- Liquidity — M2, banks' balance sheet
- Recession watch — the single composite gauge (yield-curve inversion + claims trend + unemployment rate)
Direction Coloring¶
Cards are colored by economic meaning, not raw sign. Read color, not the raw number.
| Color logic | Applied to |
|---|---|
higher_good — green on positive change |
GDP, NFP, retail sales |
lower_good — green on negative change |
UNRATE, claims, CPI, mortgage rates |
neutral — neutral accent regardless of direction |
Fed Funds, DGS rates, M2, DXY |
Recession Indicator¶
The recession panel composites four signals into a single read. The overall label is Low with no warnings, Moderate with one or two, and Elevated with three or more.
| Input | Source | Signal logic |
|---|---|---|
| 2s10s spread | T10Y2Y |
Negative (inverted) is the textbook leading recession signal — fires 6–18 months early |
| Unemployment trend | UNRATE MoM |
Rising is the Sahm-rule precursor |
| Claims trend | ICSA WoW |
Rising is the real-time labor stress tell |
| VIX level | VIXCLS |
>30 = regime change warning |
Quick screen
This is a quick screen, not a forecast. Treat each signal as context, not a standalone trigger.
AI Features¶
| Feature | Tier | Behavior |
|---|---|---|
| AI Economic Explain | Pro+ | On-demand explanation per card; 15 requests/day |
| AI Economic Outlook | Pro+ | Economic Outlook button (top right) runs a full workflow; output renders in a collapsible WorkflowCard at page top |
| AI Economic Briefing | Pro+ | Economic Briefing bar opens a summary of current readings in a side panel; Pro has a daily allowance; Terminal has no limit |
| AI Economic Summary | Terminal | Auto-loads once data hydrates; caches per session; force re-pull with the refresh control on the card |
Update Cadence¶
| Cadence | Series |
|---|---|
| Daily (after close) | FEDFUNDS, DGS rates, VIX, SP500, DXY |
| Monthly (official release day) | CPI, PCE, NFP, retail sales, housing starts |
| Quarterly (BEA schedule) | GDP |
Sparkline resolution
Card sparklines always show the 10 most recent observations from the underlying series — that means days for daily series, months for monthly series, and quarters for GDP.
HOW TO USE¶
How to read the cards¶
- Open Economic from the Macro group in the sidebar.
- Scroll to the five groups: Interest Rates & Fed Policy, Inflation, Growth & Employment, Consumer & Housing and Market & Liquidity.
- Read each card: the latest value, the change from the previous reading, a small bar trend and the date of the reading.
- Compare with the date. A monthly number such as CPI stays the same until the next release.
Free accounts see seven cards: Fed Funds Rate, 10-Year Treasury, 2-Year Treasury, CPI, Unemployment Rate, 30-Year Mortgage Rate and Housing Starts. Pro shows all of them, including core CPI, PCE prices, payrolls, jobless claims, GDP, retail sales, consumer sentiment, M2 money supply, the trade-weighted dollar, the S&P 500 and the VIX.
How to open a card's history¶
- Click a card. (Pro and Terminal.)
- Choose 1Y, 5Y, 10Y or MAX above the chart. It opens on 5 years.
- Click the card again, or the close button, to hide the chart.
On Free the cards do not open. Upgrade if you want the long history.
How to check the yield curve¶
- Find US Treasury Yield Curve at the top. The tag next to the title says NORMAL, FLAT or INVERTED.
- Tick or untick Today, 1 Month Ago, 3 Months Ago, 1 Year Ago and 5 Years Ago to compare shapes.
- Read the colored box under the chart for the 10-year minus 2-year gap in basis points.
- Use the arrow at the top right to collapse the panel. Collapsed, it still shows the 2Y, 10Y and 30Y yields.
The Bonds page goes further into spreads and funding rates.
How to see what's coming this week¶
- Look at the calendar strip under the yield curve. It shows two weeks of weekdays, this week and the next.
- Each day lists that day's releases with a colored dot for importance and a warning marker on heavy days. Released numbers are shaded green for a beat and red for a miss against forecast.
- Use the left and right arrows to move up to two weeks back or forward. Use the jump button to return to this week.
The Calendar page adds earnings, IPOs and dividends.
How to use the recession check¶
- Find Recession Indicators. It looks at four things: the 10Y-2Y yield gap, the unemployment trend, the jobless claims trend and the VIX.
- Each one flags a warning when the gap is negative, when unemployment or claims are rising, or when the VIX is above 30.
- The overall label is Low with no warnings, Moderate with one or two, and Elevated with three or more.
This is a quick screen, not a forecast.
How to get an AI read¶
- Click Economic Outlook at the top right for a written macro briefing. Pro and Terminal.
- Open the Economic Briefing bar for a summary of the current readings in a side panel. Pro has a daily allowance. Terminal has no limit.
- Click Explain on a card for a plain-English take on that number. Pro and Terminal.
Free tier upgrade gates
On Free, the 17+ non-curated series are visible in the grid but display upgrade prompts instead of values. Upgrade to Pro to unlock values, charts, and AI.
KEYBOARD SHORTCUTS¶
No keyboard shortcuts are assigned to this page. Access it via the Macro group in the sidebar or navigate directly to /economic.
RELATED¶
- Calendar — when each number prints
- Bonds — the rates side of the tape
- Watchlist — treasury ETFs fed straight into your list
TROUBLESHOOTING¶
The page says economic data is taking too long
The data source is slow. Click RETRY.
A card looks stale
Check its date. Monthly numbers only change at release.
Expanded charts are not opening on click
Expanded chart drill-downs require Pro or Terminal. On Free, card clicks trigger an upgrade prompt rather than opening the chart.
The AI Economic Summary is not loading (Terminal)
The summary caches per session. If it did not auto-load after data hydrated, use the refresh control on the card to force a re-pull.
The Economic Outlook button shows an inline error
The WorkflowButton renders rate-limit errors inline. Check your remaining daily limit on the pricing page at /manual/pricing.