§00 MOVERS¶
OVERVIEW¶
Movers answers the first question of the day: what is moving? Each board is its own page, so you can bookmark the ones you use. The boards update while their session is open, and a daily archive keeps the past.

WHAT IT IS¶
Ten category boards, each covering a different slice of the tape:
| Slice | Why it exists |
|---|---|
gainers / losers |
The biggest % moves of the live regular session |
most-active |
Where the volume actually is |
premarket |
What gapped on overnight news (4:00–9:30 AM ET) |
afterhours |
Earnings and post-close reactions (4:00–8:00 PM ET) |
overnight |
The Blue Ocean session (8:00 PM–4:00 AM ET) — the slice almost no free site covers |
crypto |
24/7, top-20 coins |
52w-highs / 52w-lows |
Names pressing their extremes |
unusual-volume |
Volume 2x or more above the 10-day average — often the first real signal |
A quality floor (price ≥ $2.00 AND volume ≥ 500k) keeps sub-$2 OTC noise off the homepage-facing boards. The statistical screens (52w-highs, 52w-lows, unusual-volume) bypass the floor — excluding low-priced names there would misrepresent the data itself.
Every board is honest about its session: outside the window, the page says so with the next-open copy instead of serving a stale list.
WHEN TO USE IT¶
- 4:00–9:30 AM: open
/movers/premarketto see what is gapping on overnight news before the open decides it for you. - Mid-session:
/movers/unusual-volumefinds names trading 2x+ their average volume — the cleanest signal something real is happening before it hits the wires. - After the close:
/movers/afterhourstracks the earnings reaction while it is still forming. - Overnight:
/movers/overnightafter 8 PM ET for Blue Ocean session prints — Tapeboard is one of the few free surfaces covering this session at all. - Journaling:
/movers/archiveto revisit what the leaderboard looked like at the close of any wild past session.
OPEN IT¶
- Path:
/movers(hub),/movers/:category(one of ten categories),/movers/archive(daily snapshot index),/movers/archive/:date/:category(frozen daily snapshot) - Shortcut: none — public page, no in-app shortcut
- Tier-gate: Free and fully public; the only paid extras are the CSV export and unmetered on-demand AI reads
FEATURES¶
Ten category pages¶
| Slug | Session window | Rank rule |
|---|---|---|
gainers |
Live RTH | changePercent > 0, sorted desc |
losers |
Live RTH | changePercent < 0, sorted asc |
most-active |
Live RTH | Real per-symbol volume, sorted desc |
premarket |
4:00–9:30 AM ET weekdays | Same as gainers during window; gated outside |
afterhours |
4:00–8:00 PM ET weekdays | \|changePercent\| desc |
overnight |
8:00 PM–4:00 AM ET + weekends | delta% × √volume |
crypto |
24/7 | Top-20 coins by 24 h change, sorted desc |
52w-highs |
Live RTH | price ≥ 52w-high × 0.995, sorted by proximity |
52w-lows |
Live RTH | price ≤ 52w-low × 1.005, sorted by proximity |
unusual-volume |
Live RTH | volume / avg10dVolume ≥ 2, sorted by ratio desc |
What each board covers¶
| Board | Window and rule |
|---|---|
| Top Gainers, Top Losers | Biggest % moves in the regular session |
| Most Active | Highest volume |
| Premarket | 4:00 to 9:30 AM ET |
| After-Hours | 4:00 to 8:00 PM ET, ranked by size of move |
| Overnight | 8:00 PM to 4:00 AM ET, the overnight trading session, covering a fixed list of popular names |
| Crypto | The top 20 coins over 24 hours |
| 52-Week Highs and Lows | Within 0.5% of the yearly high or low |
| Unusual Volume | Volume at least 2 times the 10-day average |
Outside its window a board tells you so instead of showing stale rows. Most stock boards skip stocks under $2 or under 500,000 shares, to keep out noise. The 52-week and Unusual Volume boards do not apply that filter.
TOP GAINERS¶
● Top Gainers Biggest % up movers across US exchanges.

Top Stock Gainers Today The biggest percentage gainers in the US stock market right now, refreshed every 30 seconds. This list pulls the largest % up-movers across NYSE, NASDAQ, and AMEX using live price and volume from Schwab. Click any ticker to open a full chart with stats, 52-week range, and news.
NO_ROWS_MATCHED · CHECK_BACK_SOON
PREMARKET MOVERS¶
● Premarket Movers 4:00 AM - 9:30 AM ET session gappers.

Premarket Movers - Biggest Pre-Market Gainers and Losers Stocks moving in the premarket session (4:00 AM to 9:30 AM ET). Premarket gaps often follow overnight earnings releases, FDA decisions, macro news, or guidance changes. This list is live while the session is open and shows the largest % movers with actual traded volume.
Pre-market runs 4:00 AM to 9:30 AM ET on weekdays. Check back during that window or browse the regular-session gainers below.
CRYPTO MOVERS¶
● Crypto Movers 24-hour biggest crypto gainers and losers.

UNUSUAL VOLUME¶
● Unusual Volume Trading 2x or more above their 10-day average.

Unusual Volume Stocks Today Stocks trading at 2x or more their 10-day average volume. Unusual volume is often the first sign of institutional accumulation, a news catalyst, or a pending breakout. Volume confirms price - outsized volume on a move is the cleanest signal that something real is happening.
NO_ROWS_MATCHED · CHECK_BACK_SOON
TOP LOSERS¶
● Top Losers Biggest % down movers across US exchanges.

Top Stock Losers Today The biggest percentage decliners in the US stock market right now, refreshed every 30 seconds. Useful for spotting earnings disappointments, guidance cuts, regulatory actions, and sector-wide weakness. Click any ticker to see why it's down with the full chart and news feed.
NO_ROWS_MATCHED · CHECK_BACK_SOON
AFTER-HOURS MOVERS¶
● After-Hours Movers 4:00 PM - 8:00 PM ET session movers.
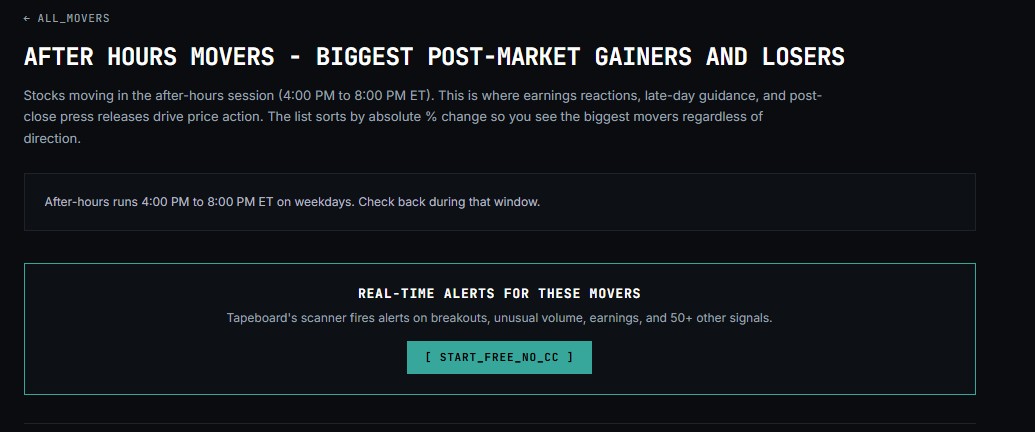
After Hours Movers - Biggest Post-Market Gainers and Losers Stocks moving in the after-hours session (4:00 PM to 8:00 PM ET). This is where earnings reactions, late-day guidance, and post-close press releases drive price action. The list sorts by absolute % change so you see the biggest movers regardless of direction.
After-hours runs 4:00 PM to 8:00 PM ET on weekdays. Check back during that window.
52-WEEK HIGHS¶
● 52-Week Highs Stocks breaking or near their 1-year peak.

Stocks at 52-Week Highs Today Stocks trading at or within 0.5% of their 52-week high, sorted by proximity to the peak. A break above prior 52-week highs is one of the cleanest momentum signals in trading - it removes overhead supply and often triggers breakout buying. Refreshed every 5 minutes.
NO_ROWS_MATCHED · CHECK_BACK_SOON
MOST ACTIVE¶
● Most Active Highest volume stocks right now.
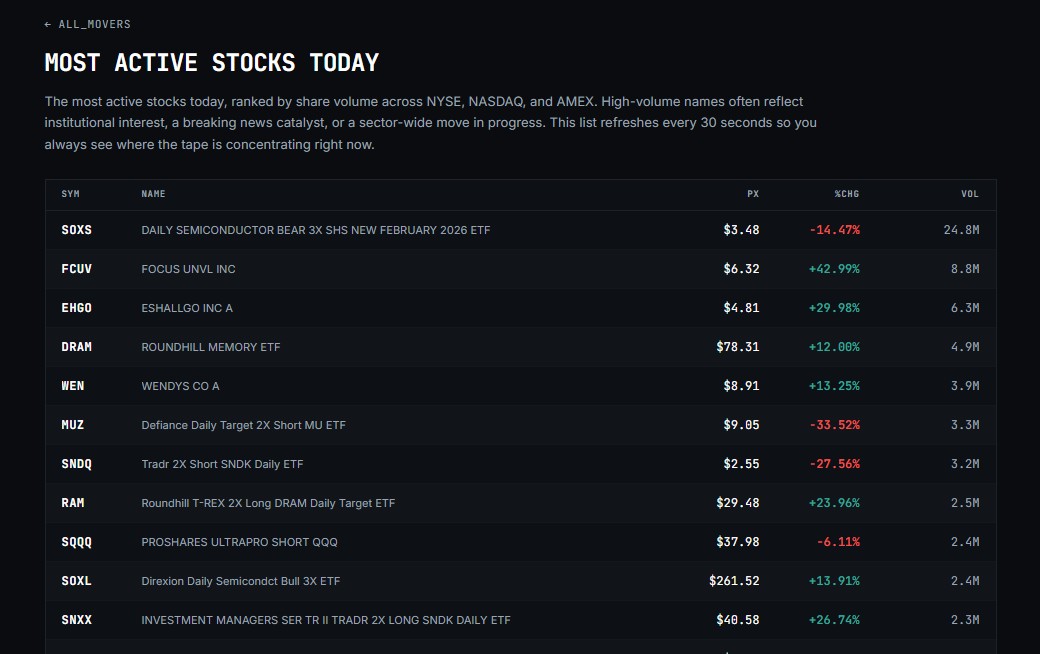
Most Active Stocks Today The most actively traded US stocks right now, ranked by share volume. High-volume names often signal institutional interest, breaking news, or a directional catalyst. Rank is live with a 30-second refresh window.
NO_ROWS_MATCHED · CHECK_BACK_SOON
OVERNIGHT MOVERS¶
● Overnight Movers 8:00 PM - 4:00 AM ET Blue Ocean session.
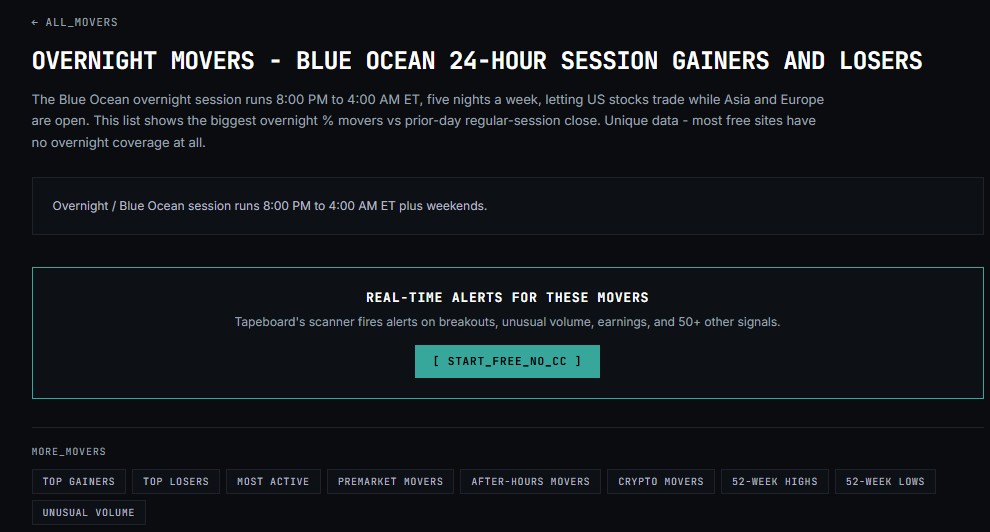
Overnight Movers - Blue Ocean 24-Hour Session Gainers and Losers The Blue Ocean overnight session runs 8:00 PM to 4:00 AM ET, five nights a week, letting US stocks trade while Asia and Europe are open. This list shows the biggest overnight % movers vs prior-day regular-session close. Unique data - most free sites have no overnight coverage at all.
NO_ROWS_MATCHED · CHECK_BACK_SOON
52-WEEK LOWS¶
● 52-Week Lows Stocks breaking or near their 1-year low.

Stocks at 52-Week Lows Today Stocks trading at or within 0.5% of their 52-week low. These are often the deepest drawdowns in the market - sometimes value opportunities, sometimes falling knives. The table sorts by how close each ticker is to its 1-year bottom.
NO_ROWS_MATCHED · CHECK_BACK_SOON
BROWSE_HISTORICAL_ARCHIVE¶
STOCK_MOVERS_ARCHIVE
Snapshots of every daily mover list since Tapeboard started tracking.

Historical daily mover snapshots. Every trading day at US market close, Tapeboard freezes the top 50 in each category so you can revisit the biggest moves from any past session.
Row columns¶
| Column | Always shown | Notes |
|---|---|---|
SYM |
Yes | Ticker; links to /chart/:symbol |
NAME |
Yes | Company name; ellipsised on narrow viewports |
PX |
Yes | Last price; 4-decimal for sub-$1 names |
%CHG |
Yes | Session % change, signed, coloured red/green |
VOL |
Yes | Session volume with K/M/B abbreviation |
52W_HI |
52w-highs only |
52-week high price |
52W_LO |
52w-lows only |
52-week low price |
VOL_RATIO |
unusual-volume only |
volume / avg10dVolume formatted as 4.2x, coloured yellow |
Freshness badge¶
The badge at the top of every board shows when the underlying snapshot was captured. If it reads DELAYED, the data is 15 minutes behind, which is what logged-out visitors get. If it reads STALE — RE-SYNCING, the source hiccuped and the page is showing the last-good list while it re-syncs — honest, not broken.
Quality floor¶
A filter of price ≥ $2.00 AND volume ≥ 500k applies to gainers, losers, most-active, premarket, and afterhours. This keeps sub-$2 OTC prints and thin-tape names off the front-facing categories.
Note
52w-highs, 52w-lows, and unusual-volume bypass the quality floor. These are statistical screens where excluding low-price names would misrepresent the data.
CSV export¶
The CSV affordance appears top-right on every board. Pro users export the full board; unauthenticated and free-tier users see the lock.
Universe coverage¶
Crypto — top-20 coins: BTC, ETH, SOL, XRP, DOGE, ADA, AVAX, DOT, LINK, MATIC, SHIB, LTC, BCH, ATOM, UNI, NEAR, APT, SUI, AAVE, ALGO. Symbols use the dotless BTCX/ETHX convention in URLs.
Overnight — fixed 70-symbol watchlist covering mega-cap tech, popular momentum names (PLTR, COIN, HOOD, MSTR, GME, DJT, CVNA), AI/quantum names (SMCI, IONQ, RGTI, ACHR), biotech (MRNA, VRTX, LLY), and select large-cap equities.
Archive¶
A cron job fires at 21:30 UTC on trading days (post-close, DST-safe), freezing the top-50 rows for seven daily-meaningful categories: gainers, losers, most-active, 52w-highs, 52w-lows, unusual-volume, and crypto. Snapshots are permanent and publicly accessible.
AI: BREAK IT DOWN¶
Every mover row carries a compact [ AI: BREAK IT DOWN ] button that opens a bottom sheet answering one question — "what's moving this stock right now" — grounded in Tapeboard's own data. It's the same button and the same sheet on the Squeeze Leaderboard, the Research masthead, the Scanner's Live Positions panel, and each row of the in-app Watchlist panel — one AI surface, wired in everywhere you'd already be looking at a ticker.

What the sheet shows¶
A short, structured card in five sections, always in this order: WHAT'S MOVING IT, BULL CASE, BEAR CASE, RISK FLAGS, and UNKNOWNS — the last one is deliberate: the model states plainly what the data doesn't tell you, instead of filling the gap with a guess. A compliance line ("What's moving the tape on TICKER — grounded in our data. Not investment advice.") sits above the content on every open, and the server's own disclaimer travels inside the card text itself. The copy is written to explain, never to recommend: no price targets, no "should you buy," no buy/sell verbs anywhere in the tool.
EARNINGS DESK tab¶
When a symbol is within about a week of its next earnings release, a second tab — Earnings Desk — appears next to Break It Down. It's a precomputed, read-only card (no on-demand generate button) covering EARNINGS QUALITY, REVENUE TREND, CASH FLOW & ACCRUALS, SURPRISE HISTORY, and RISK FLAGS, built around a pre-earnings research checklist — revenue acceleration, the accrual ratio, and buyback / share-count drift — grounded in the same SEC XBRL filings data as the Financials tab. If the cron hasn't produced a card yet for a name (or the print is more than about a week out), the tab simply doesn't appear.
Precomputed vs. on-demand¶
Today's top movers carry precomputed cards (instant, free, even signed-out). Any other symbol generates on demand — free tier gets three a day; Pro and Terminal are unmetered. If the AI backend is briefly busy the sheet waits politely instead of erroring.
HOW TO USE¶
- Open
/movers. The hub shows all ten category cards in a responsive grid. Each card names its session window and rank rule — pick the slice that matches