§23 GAMMA_EXPOSURE¶
OVERVIEW¶
Gamma Exposure (GEX) shows where options dealers are likely to hedge, and how hard, for a single stock or ETF. Where dealers are long gamma their hedging tends to hold price in place. Where they are short gamma it tends to push moves further. The page shows the strikes where that changes.
What GEX measures
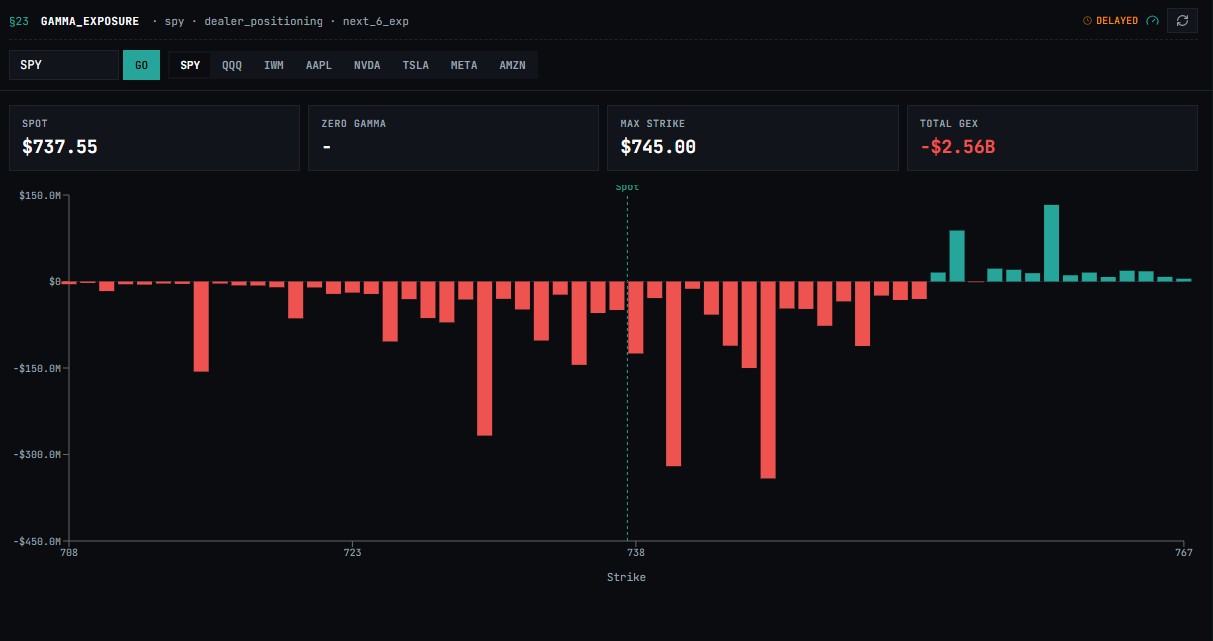
GEX aggregates the full options chain into dealer net gamma per strike. Positive bars mean dealers are long gamma — they hedge by selling rips and buying dips, dampening volatility and pinning price. Negative bars mean dealers are short gamma — they hedge by buying rips and selling dips, amplifying volatility and accelerating moves. The boundary between regimes is the gamma flip strike.
Tier gate: Pro and above. Free accounts see the upgrade gate.
ACCESS¶
| Method | Value |
|---|---|
| Default path | /gex — loads SPY |
| Custom ticker | /gex/<TICKER> |
| Keyboard shortcut | None |
Click Gamma Exposure in the sidebar. Type a ticker in the SYMBOL box, or click one of the quick symbols above it. The page loads the regime banner, the stat tiles, the levels list, and the chart.
WHEN TO USE¶
- Before any 0DTE or weekly trade on SPX, SPY, or QQQ
- Pre-event sessions: CPI, FOMC, NFP, or earnings on a high-IV single name
- When price is approaching a major strike and you need to know whether dealers will lean against the move or chase it
- Intraday: if spot crosses the gamma flip strike during the session, the volatility regime is changing in real time
Regime signal
Long gamma above the flip = mean-reversion environment. Short gamma below the flip = momentum environment. Watch for the cross.
FIELDS¶
Regime Banner¶
The banner at the top says LONG GAMMA · PINNING or SHORT GAMMA · VOLATILE, and gives the flip strike and how far it is from the current price in percent.
Stat Tiles¶
| Tile | Description |
|---|---|
| SPOT | Current underlying price |
| GAMMA FLIP | The strike where dealer gamma changes sign. Above it dealers are net long gamma and moves tend to be damped. Below it they are net short and moves tend to be amplified |
| CALL WALL | The strike with the most call gamma. It often acts as a ceiling |
| PUT WALL | The strike with the most put gamma. It often acts as a floor |
| TOTAL GEX | Net dollar gamma across all strikes and expirations included. Positive means a pinning regime; negative means a volatile one |
Hover the help icon on a tile for a short definition.
Levels List¶
LEVELS · PRICE ORDER lists spot, the flip, the call wall, and the put wall from high to low, with the distance from spot in percent. Click a level to highlight its line on the chart. Click it again to clear.
Bar Chart¶
| Bar | Description |
|---|---|
| Above zero (positive) | Dealers net long gamma at that strike — hedging is mean-reverting |
| Below zero (negative) | Dealers net short gamma at that strike — hedging is momentum-following |
Switch between Net, Calls, and Puts below the levels list. Net shows call gamma minus put gamma at each strike. Calls and Puts show each side alone. The chart marks Spot, CALL WALL, PUT WALL, and FLIP.
HOW TO USE¶
- Click Gamma Exposure in the sidebar.
- Type a ticker in the SYMBOL box or click a quick symbol above it.
- Read the regime banner — note whether spot is above or below the GAMMA FLIP to identify the current volatility regime.
- Check the five stat tiles and the LEVELS · PRICE ORDER list. Copy strikes onto a chart as horizontal lines if you want them beside your own analysis.
- Read the bar chart. Switch between Net, Calls, and Puts to isolate each side. Look for clusters of large positive bars near spot (pinning) or walls of negative bars below spot (squeeze candidate).
- Cross-reference with Options Flow — heavy unusual call buying near a positive gamma cluster often defends the level; heavy put buying below the flip accelerates downside.
- Check the freshness badge and reload the symbol to get updated data before reading the chart intraday.
Delayed data
The numbers are estimates from delayed options data. A freshness badge shows how old they are. Levels move as open interest changes, so recheck them each day.
LIMITS¶
| Constraint | Detail |
|---|---|
| Universe | Any US-listed options chain; indices and high-volume single names give the cleanest reads |
| Data freshness | Delayed; check the freshness badge on the page |
| Positioning model | Standard market-maker model (long calls / short puts from retail-side flow). Systematic vol-selling funds and exotic dealer books are not separately modeled |
| Regime underestimation | Negative-gamma regimes underestimate true vol because the model assumes static delta-hedging at strike, not continuous re-hedging at vol-of-vol |
| Reliability | Index GEX (SPX/SPY) is most reliable. Single-name GEX with sparse open interest produces noisy bars at off-the-run strikes |
| Directional signal | GEX describes likely hedging flows. It does not predict direction |
TROUBLESHOOTING¶
An upgrade card shows Gamma exposure requires a Pro plan. See Pricing.
Tiles show a dash The symbol has too little options data to find a wall or a flip. Try a larger name or an index ETF such as SPY.
The chart looks empty Switch between Net, Calls, and Puts, or reload the symbol.
RELATED¶
- Options Flow
- Charts
- Research
- Scanner