§00 PENNY_SCALP_COCKPIT¶
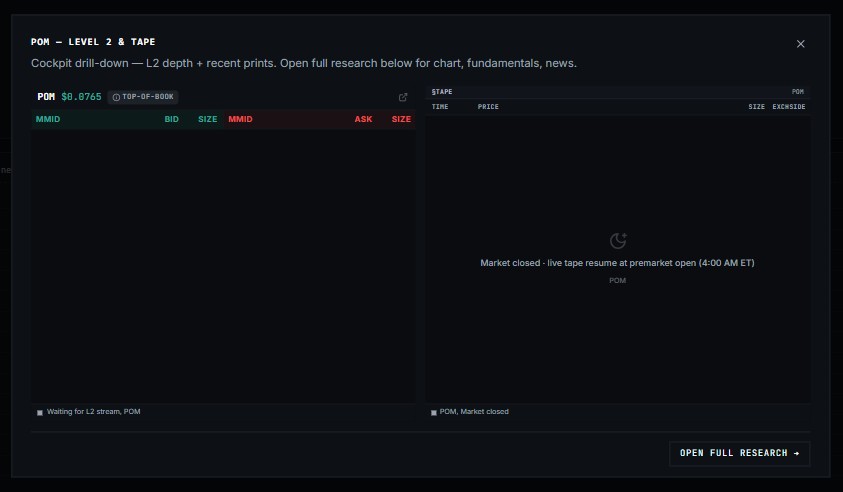
Five-cent-scalp universe — $0.30–$5.00, ≥5% intraday move, tradeable liquidity. Mover/halt quotes delayed ≥15 min; the drill-down L2 + time & sales stream live.
The PENNY_SCALP_COCKPIT is a specialized trading dashboard tailored for monitoring low-priced, high-volatility stocks (the "five-cent-scalp universe"). It tracks equities priced between $0.30 and $5.00 that exhibit an intraday move of at least 5% and possess tradeable liquidity.
Note: Mover and halt quotes are delayed by ≥15 minutes, whereas the drill-down Level 2 (L2) and time & sales streams operate live.
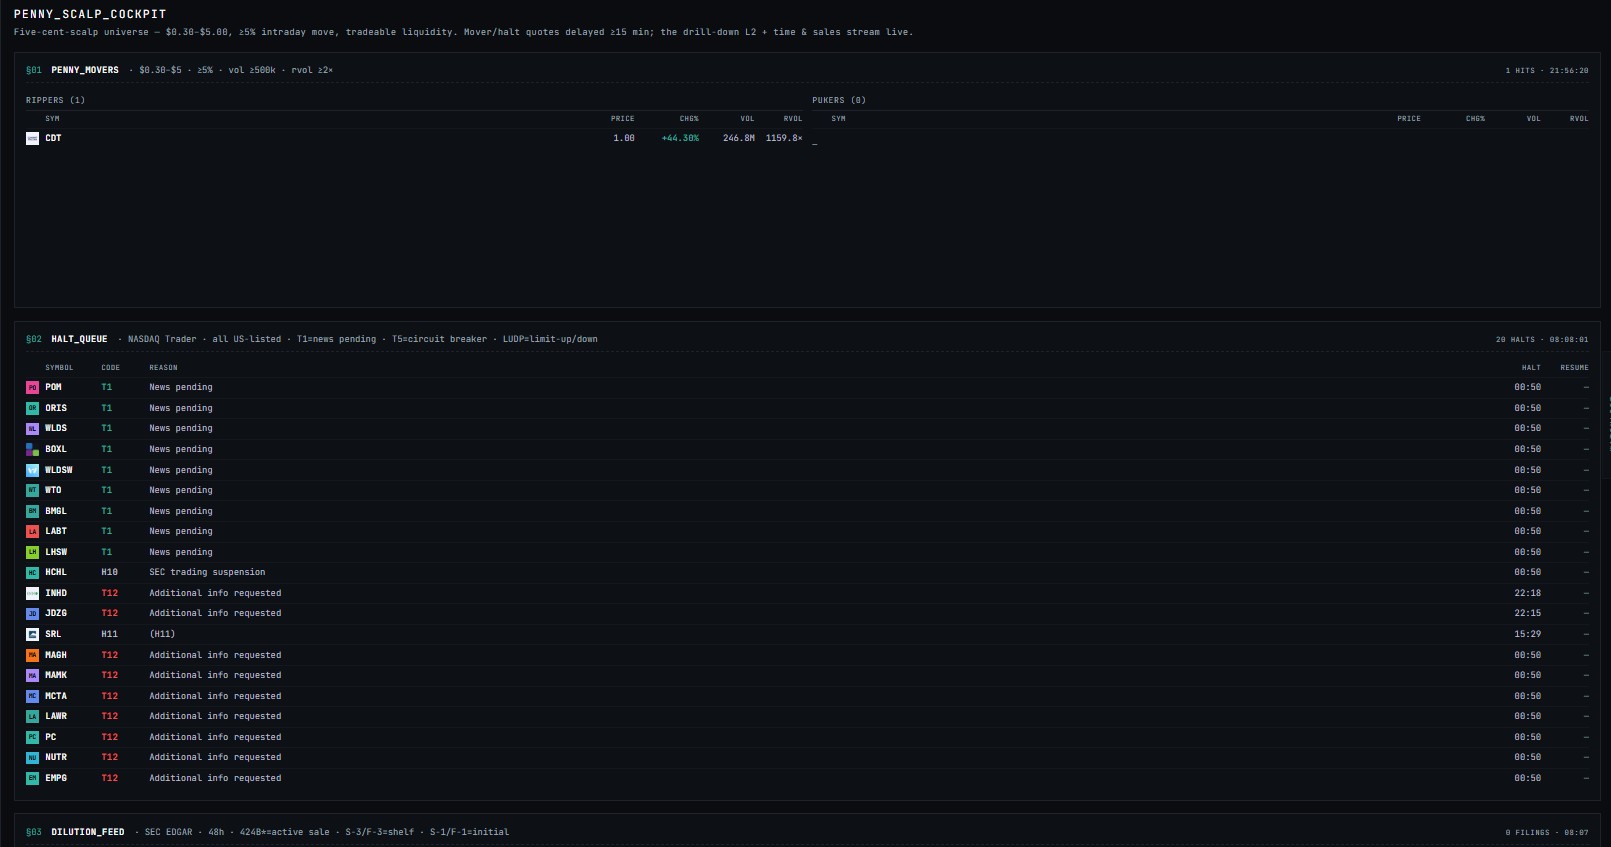
The dashboard is divided into three primary modules:
§01 PENNY_MOVERS¶
This section monitors the top gainers and losers within the penny stock universe based on strict momentum and volume criteria.
* Filtering Criteria: Stock Price $0.30 - $5.00 • Intraday Change ≥5% • Volume ≥500k • Relative Volume (RVOL) ≥2x.
* Rippers: Displays stocks surging in price (e.g., CDT showing a +44.30% change with massive relative volume).
* Pukers: Displays stocks dropping sharply in price (currently showing 0 hits).
* Data Columns: Symbol (SYM), PRICE, Change Percentage (CHG%), Volume (VOL), and Relative Volume (RVOL).
§02 HALT_QUEUE¶
A real-time feed tracking trading halts across all US-listed equities, sourced from NASDAQ Trader.
* Halt Codes Tracked: * T1 = News pending
* T5 = Circuit breaker
* LUDP = Limit-up/down volatility pause
* (Also displays other codes like T12 for additional info requested and H10 for SEC trading suspensions).
* Data Columns: SYMBOL, Halt CODE, REASON for the halt, HALT (time of halt), and RESUME (estimated or actual resume time).
§03 DILUTION_FEED¶
A monitor for recent SEC filings that could indicate potential share dilution, pulling data from SEC EDGAR over a 48-hour rolling window.
* Filing Types Tracked:
* 424B* = Active sale
* S-3/F-3 = Shelf registration
* S-1/F-1 = Initial registration
* Data Columns: FORM type, TICKER, COMPANY name, and FILED timestamp.