§01 TRADE_JOURNAL¶
OVERVIEW¶
The Tapeboard Journal is a six-tab trade log — Dashboard, Trade Log, Reports, Calendar, Playbooks, AI Analysis — built on one unified, account-size-agnostic stats engine. It computes a 0-100 Tape Score with an A-F grade, scores rule-defined Playbooks for machine-checkable adherence, auto-logs simulator trades, turns any trade into a privacy-safe share link, and ships 11 analytics reports with broker CSV import and live broker sync.
The Journal is where the loop closes. Every trade you take, every setup you tag, every R you log, every screenshot you save lands in one place, scored by a single stats engine that doesn't care how big your account is — a $2,000 account and a $2M account are graded on the same risk-normalized curve. The same engine powers the Dashboard tab, the Reports, the Tape Score, and the per-Playbook breakdowns, so no two numbers in your journal can ever disagree with each other.
Your trades are saved to your Tapeboard account (the server-side store) with an instant copy cached in your browser — so the page paints fast, your history survives a cleared browser, and your journal follows you to another device.
R, in plain words, is how many times you made back the money you risked: risk $1 per share with your stop, make $3, that trade is a 3R win. R lets a 100-share trader and a 10,000-share trader compare trades on equal footing. (Full write-up: R-multiple methodology.)
Open it with ⌘7, JOURNAL in the sidebar, or /journal/:tab (e.g. /journal/log). The Journal is free to open: Free accounts get the Trade Log showing up to 20 trades a month (your full history stays stored), the Dashboard and the Calendar over a rolling sample of your last 10 trades, plus CSV import from any of 10 brokers. Every tab is visible on every tier — the Pro ones (Reports, Playbooks, AI Analysis) show their content with an upgrade pitch inside until you're on Pro. The tier table has the exact split.
If you're brand new: Getting started covers the account basics, the Simulator guide shows you how to practice with fake money, and this guide assumes you have never kept a trading journal before.
FEATURES¶
What it is¶
A six-tab journal living at /journal/:tab:
- Dashboard — the headline KPIs, equity curve, auto-generated insights, and your Tape Score.
- Trade Log — the row-level log with add/edit-in-place, setup tagging, grades, notes, screenshots, an intraday chart per trade, a per-trade AI review, and a share button.
- Reports — 11 analytics reports sliced every way that matters.
- Calendar — a monthly P&L heatmap you can click into to filter the log.
- Playbooks — rule-defined setups that score your adherence and roll up per-setup performance.
- AI Analysis — pattern recognition plus weekly and monthly summaries over your closed trades.
The flagship is the Tape Score — a single 0-100 grade with an A-F letter that answers "how good is my process, really?" in one number, comparable across accounts of any size.
When to use it¶
After every session — log the fills (or let the simulator auto-log them), tag the setup, assign a Playbook, grade your execution, and write one daily entry on what worked. Weekly — open Reports, read the Mistake Cost report and exit-efficiency, and prune the leaks. Monthly — check whether your Tape Score letter moved and which of the five drivers is dragging it. See /trade-journal for the broader case for journaling, and /compare/tradervue-alternative for how this stacks up.
Open it¶
Path: /journal/:tab — /journal/dashboard, /journal/log, /journal/reports, /journal/calendar/2026-06, /journal/playbooks, /journal/ai.
Shortcut: ⌘7 — or open it from JOURNAL in the sidebar, or directly via /journal/:tab. The Journal is free to open: Free accounts get the Trade Log showing up to 20 trades a month (your full history stays stored), the Dashboard and the Calendar over a rolling sample of your last 10 trades, plus CSV import from any of 10 brokers. Every tab is visible on every tier — the Pro ones (Reports, Playbooks, AI Analysis) show their content with an upgrade pitch inside until you're on Pro. The tier table has the exact split.
A period selector in the header (Week / Month / Last Month / Quarter / Year / All) re-scopes every tab, and [ EXPORT_PDF ] prints a clean, print-ready report for the selected period with a tapeboard.com footer and page numbers. A REAL / SIM / ALL filter lets you scope live-vs-practice trades across every tab.
Tier-gate: Free gets Trade Log (20 trades/month shown), Dashboard, Calendar, and CSV import, all computed over a rolling 10-trade sample. Pro ($39) unlocks every tab, unlimited history, and the journal AI coach. Terminal ($79) adds CSV/JSON bulk export.

The Six Tabs¶
| Tab | URL | What it does | Tier |
|---|---|---|---|
| Dashboard | /journal/dashboard |
Tape Score, KPI hero strip, equity curve, auto-insights, day/hour breakdowns | Free (10-trade sample) |
| Trade Log | /journal/log |
Add/edit trades, setup/tag/grade, per-trade chart + AI review + share + screenshots | Free |
| Reports | /journal/reports |
11 analytics reports sliced every way that matters | Pro |
| Calendar | /journal/calendar/:ym |
Monthly P&L heatmap, click a day to drill into it | Free (10-trade sample) |
| Playbooks | /journal/playbooks |
Rule-defined setups scored for adherence | Pro |
| AI Analysis | /journal/ai |
Pattern recognition plus weekly and monthly summaries | Pro |
EXPORT_PDF¶
[ EXPORT_PDF ] in the header prints a clean report for the selected period with a tapeboard.com footer and page numbers. CSV and JSON bulk export require Terminal tier.
DASHBOARD¶
The Dashboard is the at-a-glance health read, top to bottom:
Tape Score Card¶
The 0–100 grade and A–F letter. Sits at the very top of the Dashboard. The score is built from five components, each normalized to 0-100 and weighted:
| Component | Weight | Plain words | Scoring |
|---|---|---|---|
| Profit factor | 25% | Gross wins divided by gross losses — the bang per buck of your wins | PF 1 scores about 33, PF 3 caps at 100; no losses = 100 |
| Expectancy | 25% | Your average R per trade — what one trade typically pays | Scored on R, so size-agnostic |
| Win rate | 20% | Share of closed trades that were green | Direct |
| Consistency | 15% | Percent green days — how steady you are, not how hot | Direct |
| Drawdown control | 15% | How deep your worst peak-to-valley dip went | Shallower is better |
The letter maps A at 85+, B at 70+, C at 55+, D at 40+, F below — and the composite needs 30 or more closed real trades before it shows (10 in a pure-simulator view), because a grade built from three trades is astrology, not statistics. Free sees the headline number and letter; the per-driver breakdown is Pro.
See the dedicated Tape Score section for more detail on the five scoring drivers.
KPI Hero Strip¶
KPI hero strip — a large NET_PNL number with an up/down delta vs the prior period, alongside Win Rate, Profit Factor, and Trades. Each KPI carries its own prior-period delta badge so you can see whether this week beat last week.
Equity Curve¶
An SVG curve of cumulative equity with the max-drawdown window shaded in red. The fill turns green or red with your net result.
Note
The equity curve unlocks at 3 closed trading days. Below that threshold an "EQUITY CURVE UNLOCKS AT 3 CLOSED TRADING DAYS" placeholder is shown instead of the chart.
Auto-Insights¶
A strip of plain-English findings tagged by type:
| Tag | Color | Example |
|---|---|---|
EDGE |
Green | "Your most profitable hour is 10AM" |
LEAK |
Red | "You hold losers 2.3× longer than winners — classic anti-pattern" |
NOTE |
Yellow | "Tuesdays are your weakest day" |
Up to four insights surface at once, each showing the basis it was computed from. Most require ≥ 5 trades in the bucket to display.
Secondary Stats¶
Avg Winner, Avg Loser, Profit Factor, Best Day, Worst Day, Avg Hold Time.
Goals Panel¶
Progress trackers for your active trading goals.
P&L by Day and Hour¶
Diverging horizontal bar charts (green right / red left) for day-of-week and hour-of-day breakdowns.
Note
These charts unlock at 10 trades. Below that threshold they are hidden to avoid conclusions drawn from insufficient data.
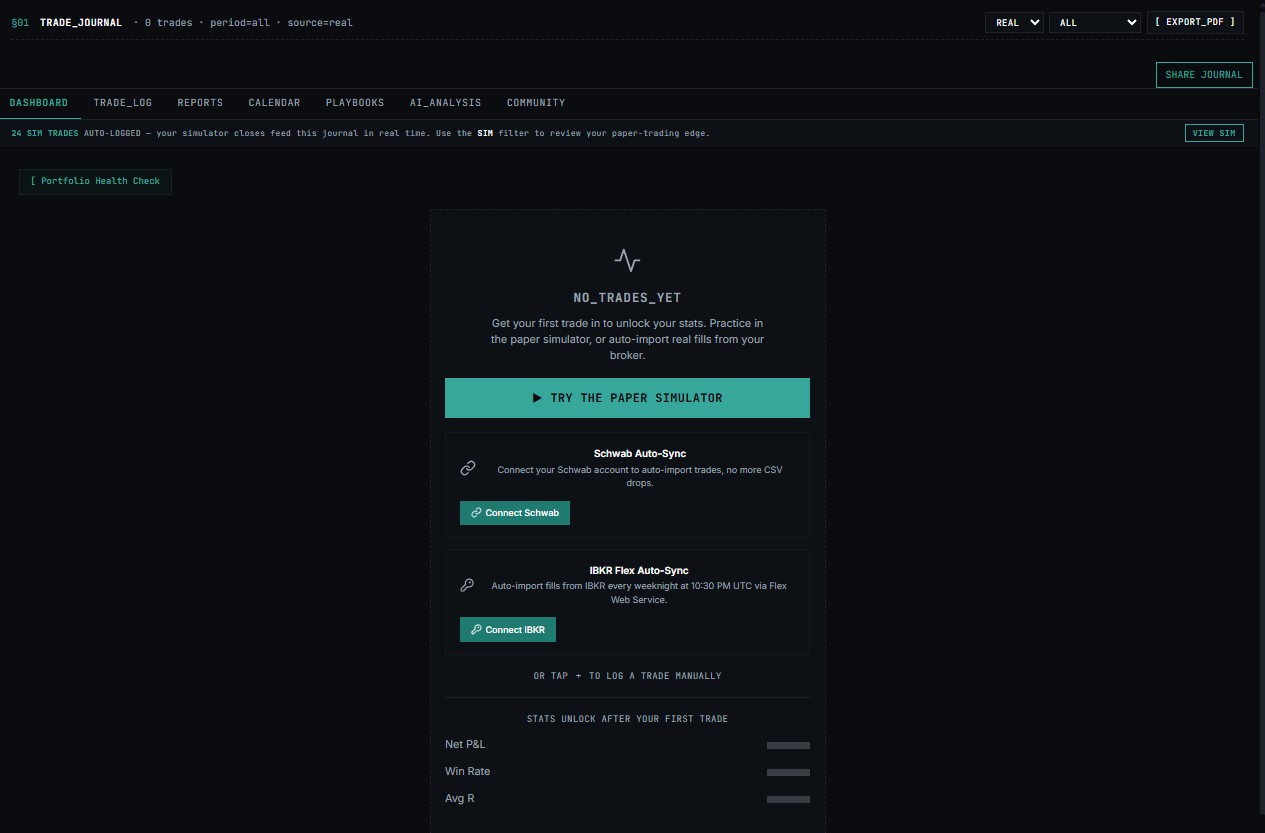
When the Journal is empty, the Dashboard shows a "NO_TRADES_YET" state with a primary CTA into the paper simulator, a secondary connect-your-broker card, and a ghost preview of the stats that unlock after the first trade.
TRADE LOG¶
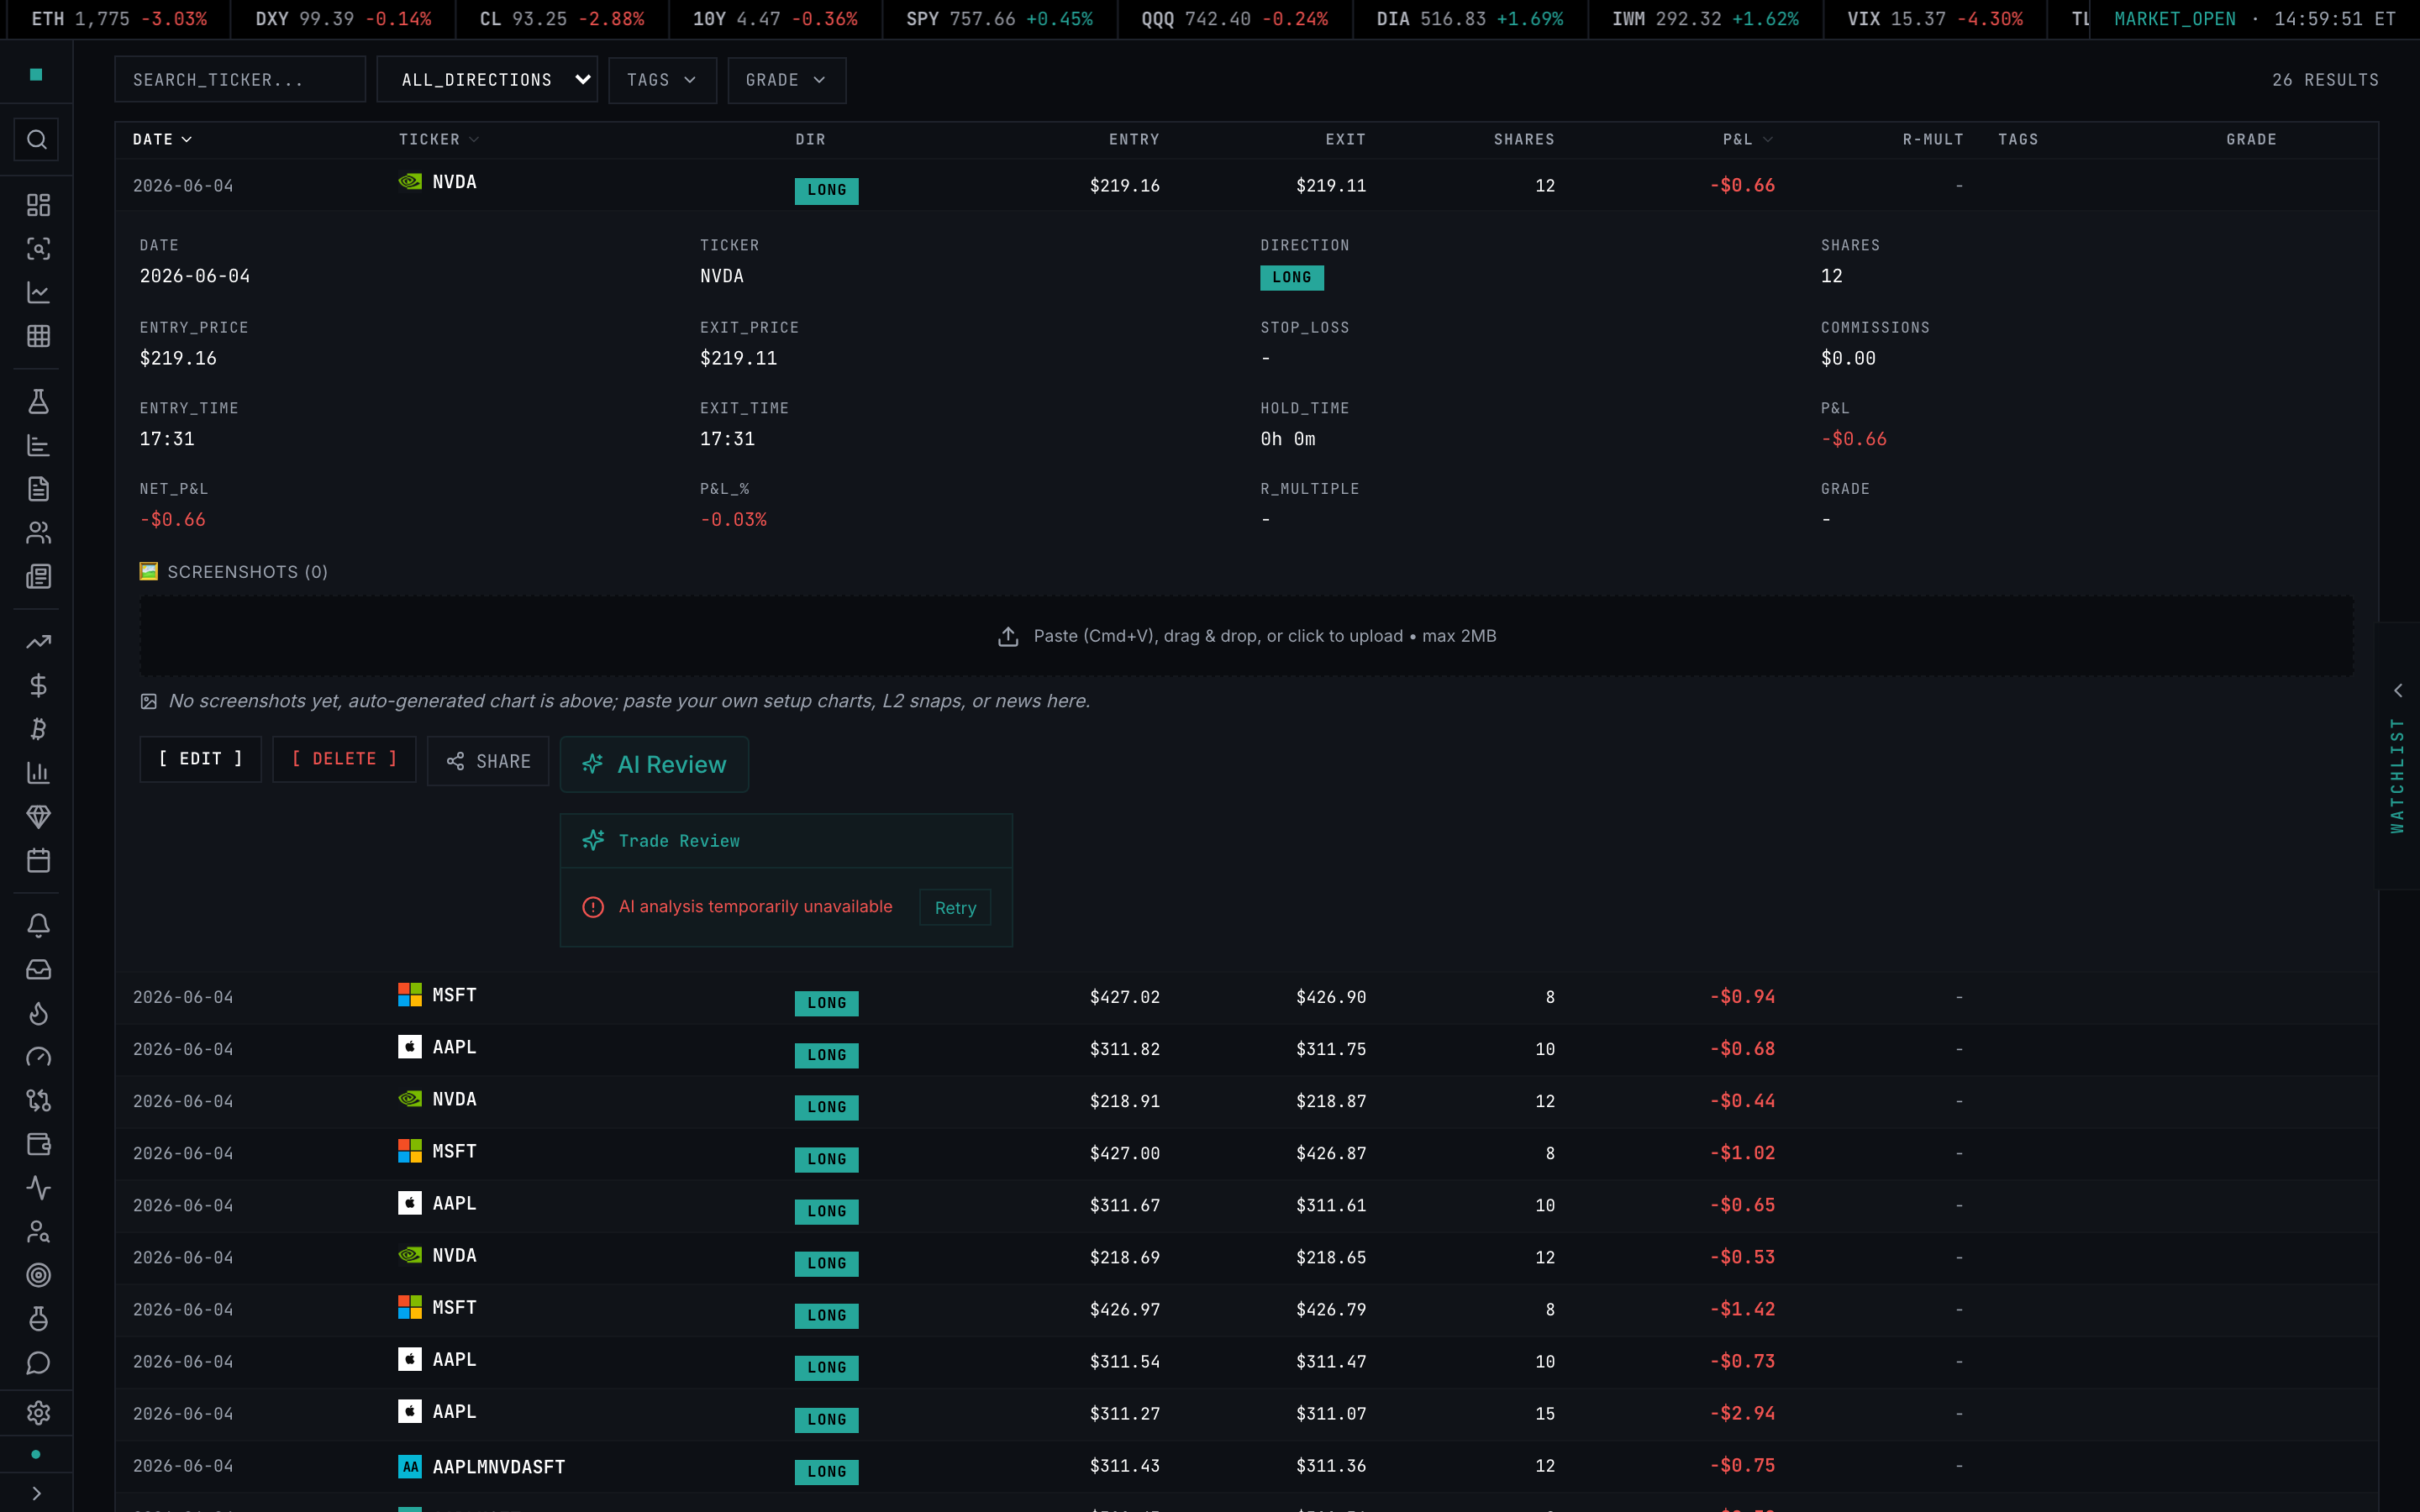
The row-level record of every trade. Supports:
- Add / edit in place — enter or correct fills directly in the row
- Setup tagging — attach a named setup to the trade
- Playbook assignment — link the trade to a rule-defined Playbook
- Execution grade — score your own execution on a per-trade basis
- Notes — free-text trade notes
- Screenshots — attach chart images to the trade record
- Intraday chart — a per-trade chart rendered inline
- AI review — per-trade AI feedback on execution and process
- Share button — generate a shareable link for the trade card
Tip
Let the Simulator auto-log fills so the Trade Log is populated without manual entry. See the Simulator documentation for setup details.
| Field | Notes |
|---|---|
| Ticker | e.g. AAPL |
| Entry / Exit Price | the fills |
| Shares | position size |
| Date | trade date |
| Direction | long / short |
| Stop Loss (optional) | drives R-multiple and Playbook risk checks |
| Commissions | netted out of P&L |
| Entry / Exit Time | drives hold-time and Playbook time-window checks |
| Setups | structured selection from your setup list |
| Playbook | optional assignment that drives adherence scoring |
| Tags | free-form labels (e.g. pre-market, news-catalyst) |
| Setup Grade | self-graded execution quality: A+, A, B, C, F |
| Notes | free text — what you saw, what you'd do differently |
| Screenshots | attached on entry, displayed in the row-expand |
Importing real fills:¶
CSV import (Pro):¶
drop a broker export and the parser auto-detects the format — common retail brokerage export formats from any of 10 brokers are recognized on paste. Fills are paired into round-trip trades automatically.
Live broker sync:¶
connect a supported brokerage account and filled orders flow in automatically; manual, imported, and simulator entries coexist, and an entry-fingerprint de-dup prevents re-imports from double-counting.
Export:¶
CSV export of the visible set; bulk CSV/JSON export is a Terminal feature.
REPORTS¶
Eleven analytics reports available on Pro and Terminal tiers, sliced across every dimension that affects edge measurement:
-
Trade Efficiency — capture % and "left on the table": how much of each move you kept vs gave back, split for winners and losers (MFE capture win/loss, max-P&L capture).
-
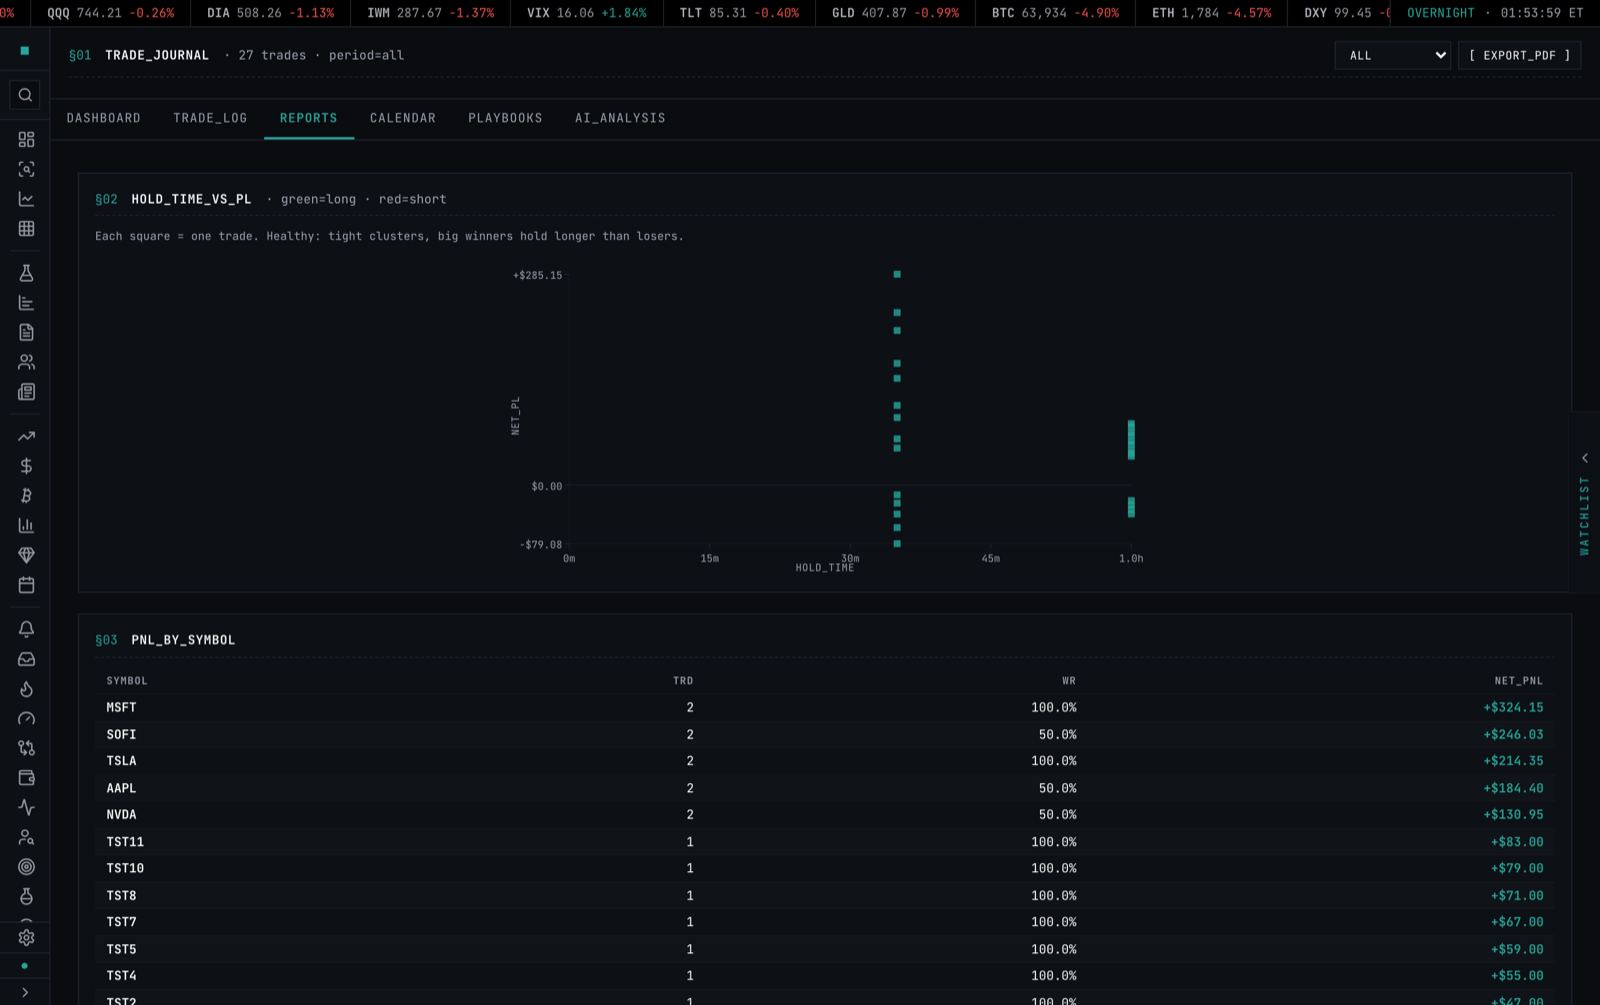
Hold Time vs P&L — a scatter of how long you held against what you made, colored by direction.
-
P&L by Symbol — which tickers pay and which bleed.
-
Performance by Setup — win rate and P&L per tagged setup.
-
P&L by Tag — performance sliced by your free-form tags.
-
P&L by Day of Week — your strong and weak days.
-
P&L by Hour — your strong and weak hours of the session.
-
P&L by Grade — does your self-graded A+ execution actually outperform your C trades?
-
Win/Loss Distribution — the shape of your wins and losses.
-
Mistake Cost Report — how much your tagged mistakes actually cost you, sorted most-costly first, in dollars and R.
-
Hold Time vs P&L (MFE/MAE) — maximum favorable vs maximum adverse excursion per trade (green tick = MFE, red tick = MAE), so you can see where you're getting shaken out early or holding losers too long.
Tip
Open Mistake Cost and Exit Efficiency weekly to locate leaks before they compound. These two reports surface the highest-leverage process improvements for most traders.
CALENDAR¶
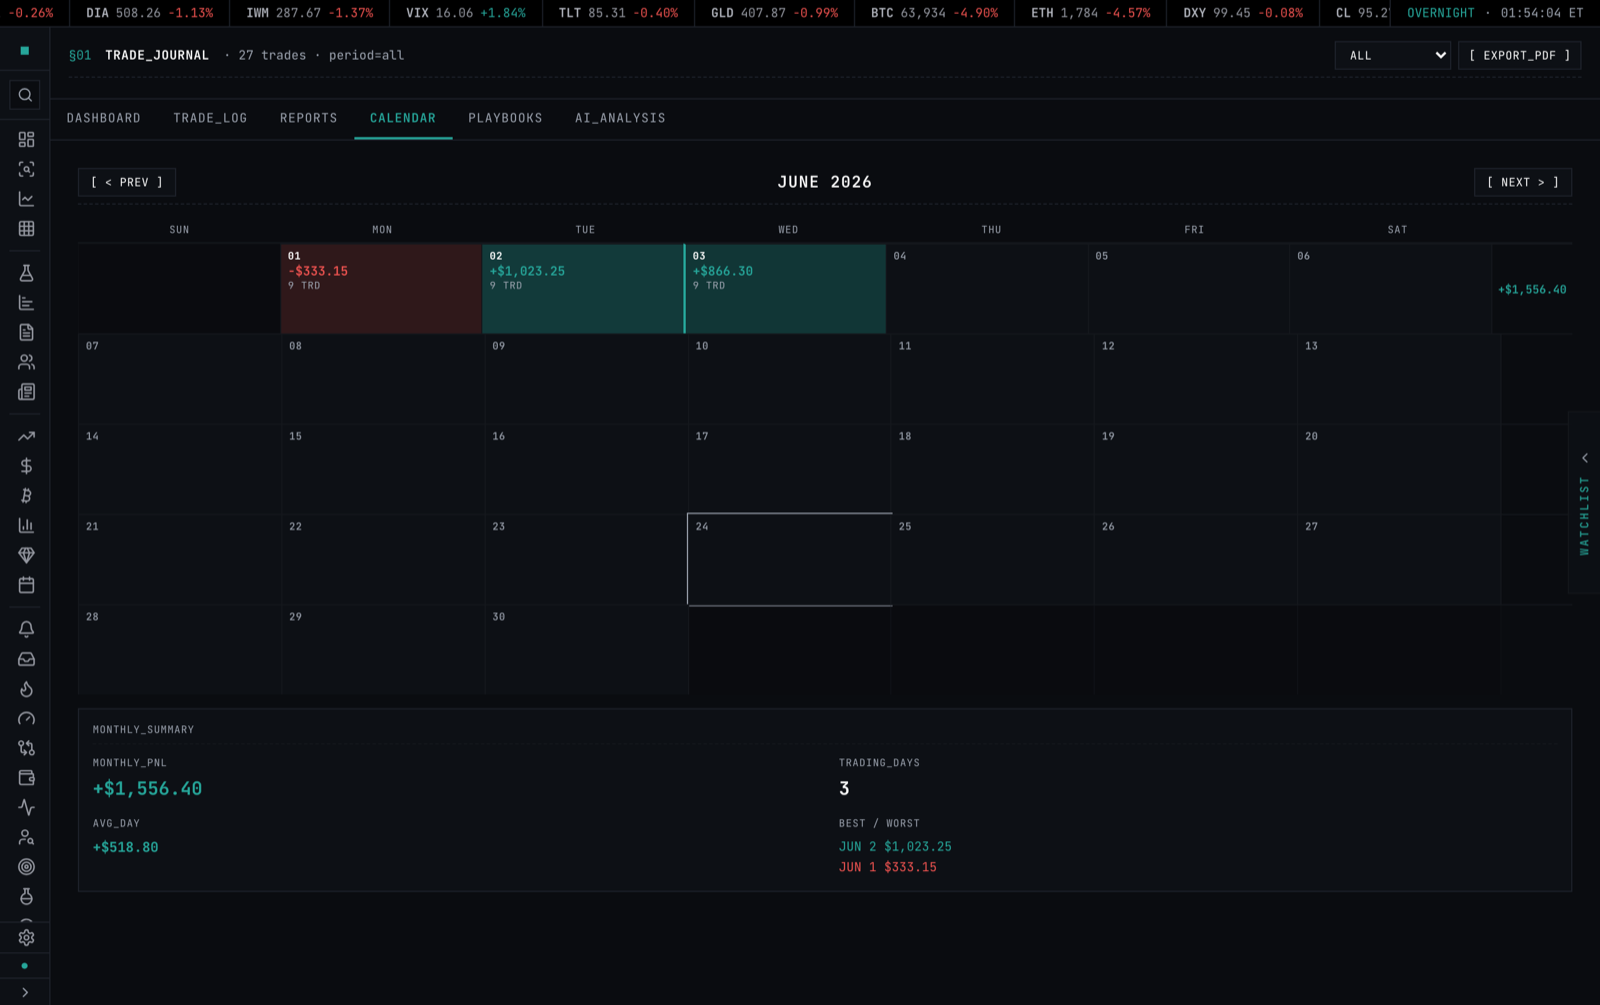
A monthly P&L heatmap at /journal/calendar/:ym (example: /journal/calendar/2026-06).
- Each day cell is colored by net P&L for that session
- Click any day to filter the Trade Log to that date
- Navigate months with the previous/next controls in the header
- Available on Free tier over a rolling 10-trade sample; full history on Pro and Terminal
PLAYBOOKS¶
Rule-defined setups that score adherence and roll up per-setup performance statistics. Available on Pro and Terminal tiers.
- Define entry rules, exit rules, and conditions for a named setup
- Each logged trade linked to a Playbook is checked against the rules automatically
- Adherence score surfaces how consistently you execute the setup as defined
- Per-Playbook stats (win rate, expectancy, avg R) roll up separately from the global stats
Playbooks (Pro) turn a fuzzy "setup" into a rule-defined, machine-checkable strategy. A Playbook is the plan; a trade references one, and the Journal scores how faithfully the trade followed it.
Creating a Playbook captures:
Name and description
Entry rule — your entry trigger, in your own words
Stop rule and target rule
Time window — timeStart–timeEnd (24h HH:MM; blank = no constraint)
Require-stop flag — does this setup demand a stop?
Target R:R — the minimum reward:risk you're aiming for (minRr)
Assigning a trade — pick the Playbook from the dropdown in the trade form. The Journal then scores two things automatically:
Adherence — did you follow the rules you actually wrote? It checks only the objective, machine-verifiable ones (no outcome, no subjective input): (1) did you enter inside the time window, and (2) did the trade carry a stop (when the Playbook requires one). Each check passes or fails; adherence is the percentage passed. If a Playbook defines neither rule, adherence is N/A.
Per-playbook performance — win rate, expectancy, average R, trade count, and average adherence, rolled up per Playbook off the same unified engine. This is how you tell whether your edge comes from the *setup* or from *breaking your own rules*.

AI ANALYSIS¶
Pattern recognition and narrative summaries over your closed trade history. Available on Pro and Terminal tiers.
- Weekly summaries — an AI recap of the current week. Needs 3+ trades this week.
- Monthly summaries — an AI recap of the current month. Needs 5+ trades this month.
- Pattern recognition — a structured read of recurring patterns across your trades. Unlocks at 10 trades.
Each shows a live progress bar toward its unlock threshold while locked. Two more AI surfaces live outside this tab: the per-trade AI review in the expanded Trade Log row, and the Portfolio Health check on the Dashboard, which reads your traded symbols and returns a health read on the names you're carrying.
![