§07 CORRELATION_MATRIX¶
OVERVIEW¶
Correlation measures whether two stocks move in the same direction on the same days. A reading of +1.00 means they move in lockstep, 0 means no link and −1.00 means they move opposite. If every name you hold is above +0.80 against the others, you own one bet in several tickers. Free accounts get up to 5 tickers and the 30D and 90D windows. Pro adds up to 10 tickers and the 180D and 1Y windows.
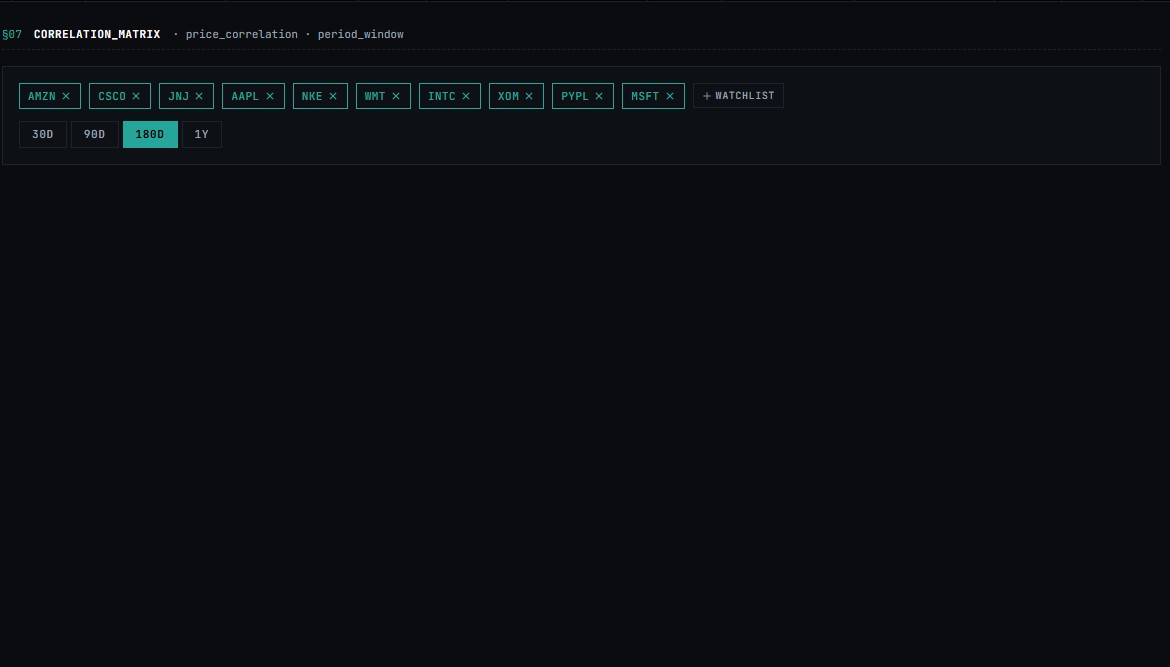
The tool pulls daily closing prices for each symbol over the selected window, converts them to a returns series using simple period-over-period returns (p_i − p_{i−1}) / p_{i−1}, runs Pearson across every pair, and returns the full matrix. Results are cached per symbol set and window, so reordering tickers in the UI does not trigger a refetch.
Note
The window options are calendar days, not trading days. Trading-day filtering is applied server-side before the computation runs.
FEATURES¶
Color Encoding¶
Values run from −1.00 to +1.00. Cell backgrounds bin the correlation strength as follows:
| Range | Background | Text color |
|---|---|---|
| ≥ 0.80 | Dark green | Green |
| 0.50 – 0.79 | Medium green | Green |
| 0.20 – 0.49 | Faint green | Neutral |
| −0.20 – +0.20 | Transparent | Neutral |
| −0.21 – −0.49 | Faint red | Neutral |
| −0.50 – −0.79 | Medium red | Red |
| ≤ −0.80 | Dark red | Red |
The diagonal is always 1.00, dimmed and shaded — a symbol is perfectly correlated with itself.
Cells between −0.20 and +0.20 are left blank, meaning little link. Numbers at or above +0.50 print in green and at or below −0.50 in red.
Feature flags: correlation.fullTickers and correlation.allPeriods control the tier gates. Hard cap across all tiers is 30 symbols per request. Day-count range is clamped between 30 and 2000 days.
Fields¶
| Column / Cell | Description |
|---|---|
| Row header | Ticker in monospace green |
| Column header | Same tickers repeated across the top |
| Cell value | Pearson correlation of daily returns over the window, rounded to two decimals |
| Cell background | Color bin as described above |
| Cell text color | Green ≥ 0.50, red ≤ −0.50, neutral in between |
| Diagonal | Always 1.00, dimmed and shaded |
HOW TO USE¶
Path: /correlation
Sidebar group: §TOOLS
Keyboard shortcut: None
HOW TO BUILD A MATRIX¶
- Click Correlation in the sidebar.
- Type a ticker in the ADD_SYMBOL… box and pick it from the list. Repeat for each name.
- Or click + WATCHLIST to load your watchlist, up to your limit.
- Click the × on a ticker's chip to remove it.
- The matrix appears as soon as you have two tickers. Adding or removing one recalculates it.
The page opens with a starter group of large tech names, or with the first symbols of your watchlist if you have one.
HOW TO CHANGE THE WINDOW¶
- Click 30D, 90D, 180D or 1Y above the matrix.
- The matrix recalculates on daily returns over that many calendar days.
Windows with a padlock need Pro. Short windows show how names behave lately. Long windows show how they behave over a full cycle, so check both before you trust a pair.
HOW TO READ THE MATRIX¶
Find your ticker in the row at the left and another ticker in the column across the top. The cell where they meet is their correlation.
The diagonal is always 1.00, because a stock moves with itself.
Green cells move together and red cells move against each other. The deeper the color, the stronger the link. Cells between −0.20 and +0.20 are left blank, meaning little link.
Numbers at or above +0.50 print in green and at or below −0.50 in red.
Reading the matrix
Start with the corners. The top-left to bottom-right diagonal is always 1.00. Off-diagonal greens mean the pair moves together; reds mean the pair moves opposite. Faint or transparent cells are your diversifiers.
Common Use Cases¶
- Diversify — look for a low or negative number against your biggest holding.
- Check overlap — a whole row of high greens means those names are the same trade.
- Spot a break — a pair that is usually high but drops has started to decouple.
GOOD TO KNOW¶
- Correlation looks backward and changes with the window. It can jump in a market shock, when many things fall together.
- It uses daily closing prices, so it says nothing about the moves inside a day.
- Returns use simple period-over-period returns, not log returns. Results are accurate for typical equity pairs over months but diverge at extreme single-day moves.
- Pearson assumes a roughly linear relationship. Nonlinear pairs (for example, a stock versus its own put-write yield) will appear weaker than they trade.
- Pearson over short windows is noisy by design. A single large gap day can shift the 30D reading significantly. Use the 90D or longer window to confirm a structural relationship before acting on it.
- To see the price paths side by side, use Compare.
- Results are cached. To force a refresh, add or remove a ticker, or change the window.
TROUBLESHOOTING¶
No matrix Add at least two tickers.
You cannot add another ticker You reached your limit — 5 on Free and 10 on Pro.
A window is locked 180D and 1Y need Pro. See Pricing.
A ticker is missing from the matrix It has too little price history in that window.
§ERR / CORRELATION · feed unavailable
The price feed failed for the entire batch. This is usually a brief outage. Refresh after 30 seconds. If the error persists, check the Tapeboard status channel.
Correlations look unstable week to week Pearson over short windows is sensitive to outlier days. A single 8% gap can shift the 30D reading materially. Cross-reference against the 90D or 1Y window to distinguish noise from a structural change in the relationship.