§02 CHARTS¶
OVERVIEW¶
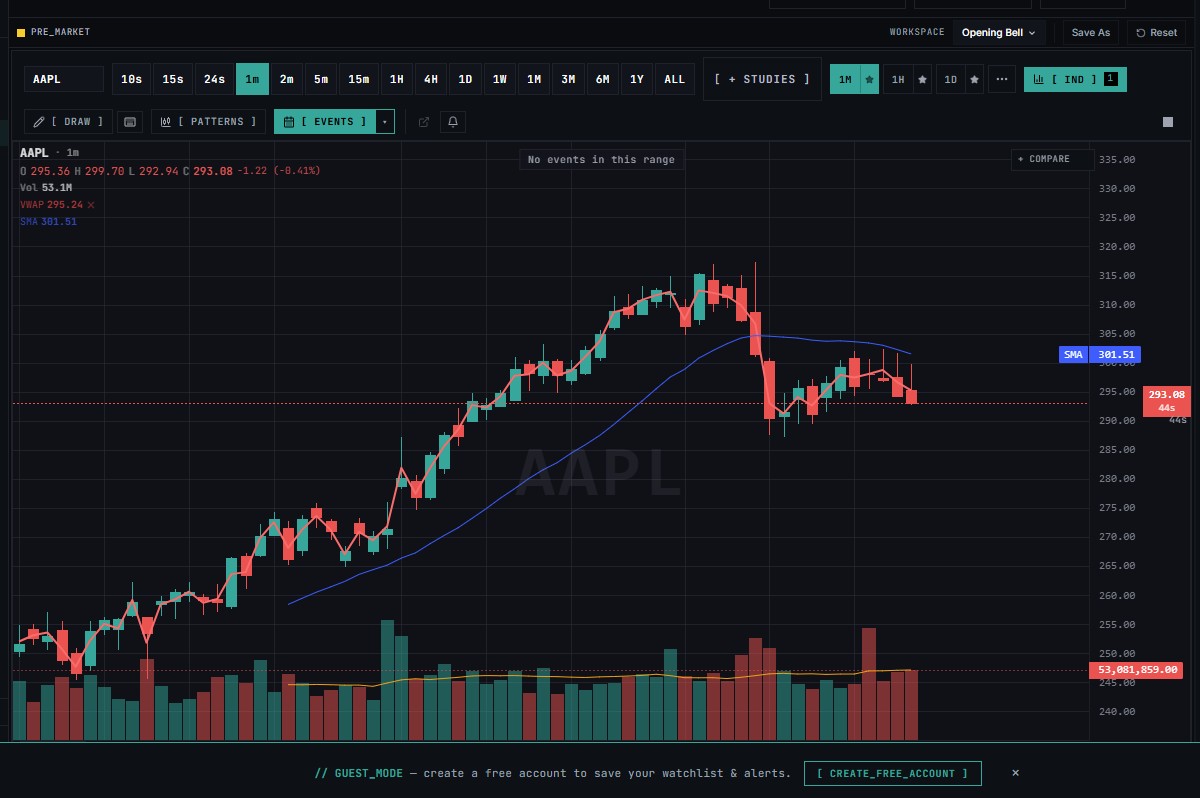
Tapeboard Charts runs live in your browser on stocks and crypto. You get a price chart with a volume pane, a drawing rail on the left, an indicator list, a compare tool, and a countdown to the next bar. This page covers the basics. Indicators, drawing tools, layouts, and alerts each have their own page.
Where Charts Appear
The same engine powers the /charts workstation, the scanner workspace, research pages, and the simulator replay cockpit. Every tool and indicator described here is available wherever a chart appears.
FEATURES¶
Chart Types¶
Click the chart type button next to the timeframe (it reads Candles until you change it) to pick a type. The chart redraws with the same data. Point and figure and Kagi ignore time and draw price moves only, so they show fewer bars than the others.
| Type | Description |
|---|---|
| Candles | Default OHLC candlestick view |
| Hollow Candles | Candlestick with hollow bodies |
| Volume Candles | Candle width scaled by volume |
| Bars | Classic OHLC bar chart |
| High-Low | High-low range bars only |
| Line | Close-only line |
| Line with Markers | Close line with bar markers |
| Step Line | Close line rendered as steps |
| Area | Close line with a filled gradient |
| HLC Area | High-low-close area band |
| Baseline | Area split above/below a baseline — green above, red below |
| Columns | Volume-style column bars on price |
| Histogram | Histogram bars on price |
| Point and Figure | Ignores time; draws price moves only |
| Kagi | Ignores time; draws price moves only |
The price scale can be toggled independently between Linear, Logarithmic, Percent, and Indexed to 100 from the right-click Scale submenu on the price axis. The same menu offers Auto-fit to the data, Invert, Move the scale to the left, and Axis settings.
Timeframes¶
Use the timeframe menu at the left of the toolbar. The available timeframes are 10s, 15s, 30s, 1m, 2m, 5m, 15m, 1H, 4H, 1D, and 1W.
The last candle keeps moving while the bar is open. The price tag on the right axis counts down to the close of the bar.
Sub-minute Timeframes
The 10s, 15s, and 30s timeframes are open to everyone on the Crypto page. On stocks they require a signed-in Pro account.
Compare Tool¶
Click COMPARE in the toolbar, type a ticker (e.g. SPY), and press Enter or click ADD. The chart switches to percent scale and draws the new symbol as a second line. Up to four symbols can be added, each in its own color. Click the × on a symbol chip to remove it.
For a full-page view of many tickers side by side, use the Compare page.
Extended Hours¶
Open a stock on an intraday timeframe (1m to 4H). An EXT button appears in the toolbar. Click EXT to switch between regular hours only and regular plus extended hours. The button shares its setting with Show extended hours in Settings. EXT does not appear on crypto (which trades around the clock) or on daily and weekly charts.
Drawing Tools¶
The rail on the left holds the drawing tools. See the Chart drawing tools page for full documentation.
Magnet Mode
Toggle MAGNET in the toolbar to snap drawing endpoints to OHLC values on the nearest bar, improving placement precision when marking exact highs, lows, opens, or closes.
Clearing Drawings
CLEAR ALL (N) appears with a dropdown so you can wipe just horizontal lines, just Fibs, or other specific object types rather than everything at once.
Indicators¶
Click INDICATORS in the toolbar to open the indicator list. See the Chart indicators page for full documentation.
Alerts¶
Stock charts have an ALERTS button in the toolbar. See the Chart alerts page for full documentation.
Multi-Chart Layouts¶
To see several charts at once, see the Chart layouts page.
Pro Feature
Multi-chart layouts require a Pro subscription.
Data Window¶
The strip above the chart shows open, high, low, close, and volume for the bar under your cursor. Move off the chart to see the latest bar.
HOW TO USE¶
Open the workspace
- Click Charts in the sidebar, or open a chart from the Scanner or a watchlist.
- For crypto, use the chart on the Crypto page.
- Type a ticker in the symbol box to switch symbols.
- Append a ticker to the URL to land directly on a symbol:
/chart/NVDA
Change the timeframe
- Use the timeframe menu at the left of the toolbar.
- Choose from: 10s, 15s, 30s, 1m, 2m, 5m, 15m, 1H, 4H, 1D, 1W.
Select a chart type
- Click the chart type button next to the timeframe.
- Pick a type from the list.
Switch to log or percent scale
- Right-click the price axis on the right edge of the chart.
- Under Scale, choose Linear, Logarithmic, Percent, or Indexed to 100.
Compare with another symbol
- Click COMPARE in the toolbar.
- Type a ticker and press Enter or click ADD.
- Click the × on a symbol chip to remove it.
Show pre-market and after-hours bars
- Open a stock on an intraday timeframe (1m to 4H).
- Click the EXT button that appears in the toolbar.
Add a drawing
- Use the drawing rail on the left of the chart. On a phone, drawing tools sit behind a Draw bar at the bottom of the chart.
Add an indicator
- Click INDICATORS in the toolbar to open the indicator list.
TROUBLESHOOTING¶
| Symptom | Resolution |
|---|---|
| No bars, or an old last candle | Switch the timeframe and back. A banner above the chart tells you when the feed is delayed or still warming up. |
| 10s, 15s, or 30s is missing on a stock | It requires a signed-in Pro account. |
| A comparison symbol won't add | Check the ticker. The limit is four symbols. |
| EXT is missing | You are on crypto or a daily chart. |
Still stuck? Email [email protected] and Marcus will help.
KEYBOARD SHORTCUTS¶
| Shortcut | Action |
|---|---|
⌘3 / Ctrl+3 |
Open the Charts workstation |
D |
Switch to daily candles |
1 |
Switch to one-minute candles |
[ / ] |
Step through timeframes |
ESC |
Deactivate the active drawing tool |
⌘S |
Save the current layout |