§14 OPTIONS_CHAIN¶
OVERVIEW¶
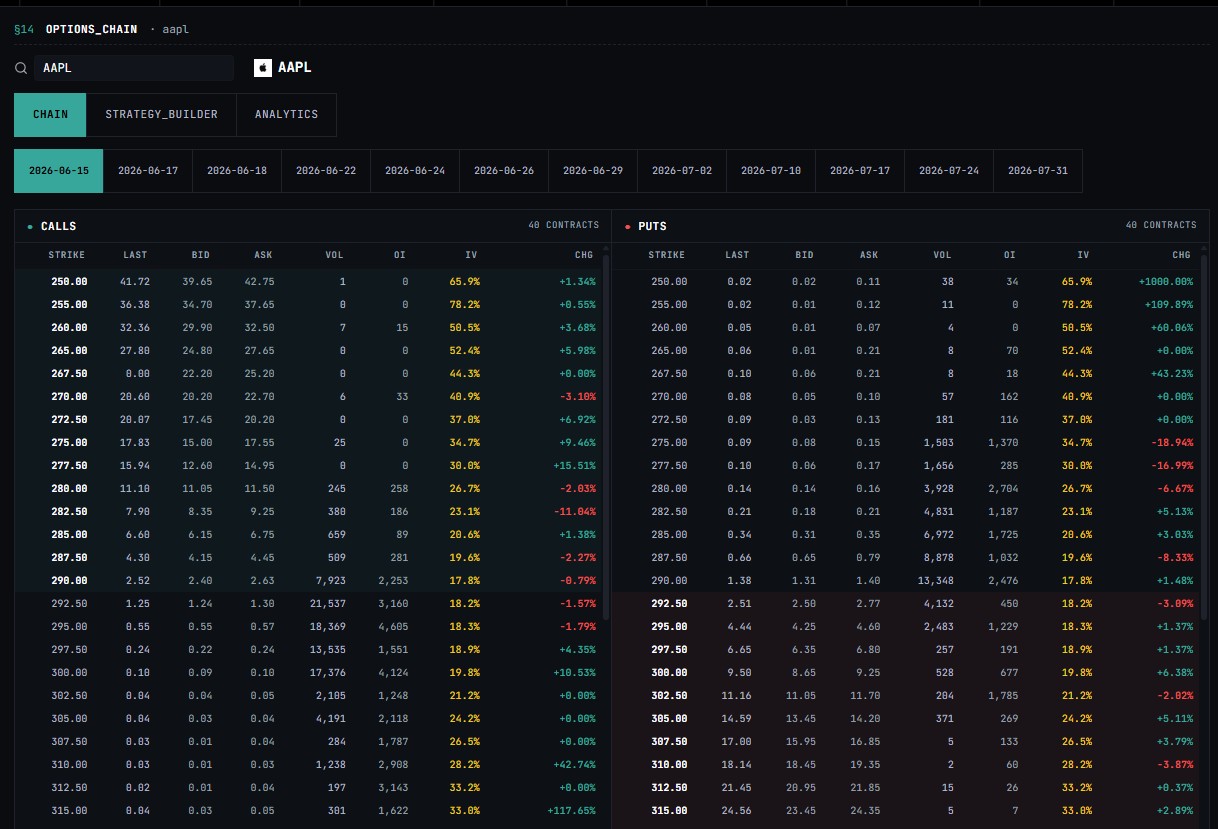
A live US options chain for any listed underlying. Calls display on the left, puts on the right, strikes sorted ascending, with ITM contracts tinted for instant orientation. Three modes operate under a single symbol input.
| Mode | Purpose |
|---|---|
CHAIN |
Raw strike grid for a selected expiration |
STRATEGY_BUILDER |
Multi-leg trade modeler with payoff diagram and Greeks |
ANALYTICS |
IV summary, put/call gauges, and volatility smile |
Note
The live chain is Pro. Free/authed sessions and anonymous visitors see an upgrade card in place of the chain. Options Flow (sweep and block detection) and Gamma Exposure (dealer positioning) are separate Pro surfaces.
OPENING THE PAGE¶
| Method | Detail |
|---|---|
| Default URL | /options — loads AAPL by default |
| Direct ticker | /options/TSLA — jumps straight to a symbol |
| Symbol input | Type a ticker in the SYMBOL box and click LOAD; URL updates for sharing |
| Sidebar | Reachable from the main navigation sidebar and the mobile command bar |
FEATURES¶
Option Chain¶
The CHAIN tab renders two synchronized grids — CALLS (left) and PUTS (right) — for a single selected expiration.
- Strikes run ascending top to bottom
- ITM rows are tinted — faint green for ITM calls, faint red for ITM puts; the tint boundary follows spot
- The money line is visible at a glance without manual scanning
Columns¶
| Column | Description |
|---|---|
STRIKE |
Contract strike price |
LAST |
Last traded premium |
BID |
Current best bid |
ASK |
Current best ask |
VOL |
Session volume for this contract |
OI |
Open interest as of prior close |
IV |
Implied volatility |
Δ |
Delta — how much the option price moves for a one-dollar move in the stock |
Γ |
Gamma — how fast delta changes |
Θ |
Theta — the value the option loses each day |
VEGA |
Change for one point of implied volatility |
CHG |
Net change from prior close |
A thin bar behind each VOL and OI number shows how big it is against the other strikes on that side, so heavy strikes stand out.
Note
On a phone the table keeps Strike, Last, Bid, Ask, and Vol. The rest show on a wider screen. Greeks shown in the Strategy Builder are model-estimated for a strategy 30 days out at 30% implied volatility — a quick check on direction and risk, not exact figures for your contracts. The Greeks in the chain are per contract.
Expirations¶
The pill row beneath the tab bar lists up to 12 listed expirations, nearest first. The closest expiry is selected on load. Click any pill to refilter both grids to that date. Expirations beyond the 12th exist in the underlying data but are not selectable from this row. The picker scrolls horizontally on narrow screens.
Summary Strip¶
A summary strip below the grids displays aggregated data for the selected expiry:
- Total call volume and total put volume
- Put/call volume ratio
- Total call open interest and total put open interest
Note
Thin weeklies can make the ratio read extreme; switch expiries to normalize.
Strategy Builder¶
The STRATEGY_BUILDER tab provides a multi-leg trade modeler. Use it to define a position and read risk metrics and a payoff curve before placing anything.
Presets¶
Click a preset to populate legs automatically (hover a chip for the structure). All forecast legs off the underlying's current price; edit any leg after:
- Covered Call
- Protective Put
- Bull Call Spread
- Bear Put Spread
- Iron Condor
- Straddle
- Strangle
- Butterfly Spread
Manual Legs¶
Click Add Leg and configure each leg individually:
| Field | Options |
|---|---|
| Type | Call / Put |
| Side | Buy / Sell |
| Strike | Any listed strike |
| Premium | Auto-filled or manual override |
| Quantity | Number of contracts |
Trash a row to remove it. Clear wipes all legs.
Underlying Price¶
The Underlying price field in the builder header auto-fills from the live quote. Override it to model a what-if scenario at a different spot price.
Analysis Panel¶
| Output | Description |
|---|---|
| Max Profit | Maximum gain at expiration |
| Max Loss | Maximum loss at expiration |
| Net Cost | Net debit or credit for the position |
| Break-evens | Price levels where P&L equals zero (interpolated) |
| Greeks (Δ/Γ/Θ/ν) | Model-estimated combined Greeks for the full position, sign-aware — computed off a fixed ~30-day/30%-IV model. Directional honest, not a hedging surface. |
P&L Diagram¶
The P&L AT EXPIRATION payoff diagram plots the combined position value across the strike range. Green areas indicate profit, red areas indicate loss, yellow dashed lines mark break-even prices, a blue dashed vertical marks the spot price, and leg dots sit on the zero line (green for calls, red for puts). Hover for the x-y readout.
Analytics¶
The ANALYTICS tab provides a chain-level read on implied volatility and sentiment without requiring manual reconstruction.
| Section | Detail |
|---|---|
| IV Summary | ATM call IV, ATM put IV, and average IV over valid (non-zero-IV) contracts in the expiry. Call-vs-put IV gap is the fast skew read. |
| Volume Gauge | Put/call volume ratio: under 0.7 reads Bullish, above 1.0 reads Bearish, middle is Neutral. The volume gauge is the tape. |
| Open Interest Gauge | Put/call OI ratio: under 0.7 reads Bullish, above 1.0 reads Bearish, middle is Neutral. The OI gauge is the stance. |
| Volatility Smile | IV by strike, calls plotted green vs puts plotted red, dashed vertical at the money. No interpolation: a missing strike breaks the line. |
HOW TO USE¶
Scan the chain
- Open
/options. AAPL loads by default, or navigate to/options/TSLAfor a specific ticker. - Click an expiration pill to filter both grids to that date. The nearest expiry is selected automatically.
- Read the strike ladder on the CHAIN tab — identify where premium is concentrated, where the bid/ask spread is wide, and where open interest is stacked.
- Check the summary strip below the grids for the aggregate put/call volume ratio and open interest totals.
Model a trade
- Switch to the STRATEGY_BUILDER tab.
- Click a preset or click Add Leg to build a custom structure.
- Confirm the Underlying price or override it for a what-if scenario.
- Review Max Profit, Max Loss, Net Cost, and Break-evens in the Analysis panel.
- Check the P&L diagram to visualize the full payoff profile at expiration.
Read IV and skew
- Switch to the ANALYTICS tab.
- Read the IV summary for the ATM level and average across the chain. Note the call-vs-put IV gap for a fast skew read.
- Check the volume and OI gauges for a directional sentiment reading.
- Inspect the volatility smile for skew — steepness and asymmetry between calls and puts.
Paper-trade an option
Practice a spread with play money in the simulator. See Simulator. A risk notice appears before you place your first options trade.
Tip
Use CHAIN to locate strikes of interest, STRATEGY_BUILDER to size and structure the trade, and ANALYTICS to check the IV environment before committing.
Note
This page covers chain analysis only. For institutional sweep and block detection use Options Flow. For dealer gamma positioning use Gamma Exposure.
DATA NOTES¶
- Data source: US-listed (OPRA) options only. No futures options.
- Chain loads all strikes across all listed expirations on LOAD, then filters to the selected expiry — expect minute-level staleness intraday; the chain does not re-pull on a timer
- Strike depth is approximately 20 above and below the money per expiry; LEAPS wings exist upstream but are not rendered
- Expiry picker tops out at 12
- A Pro subscription is required for live pulls; free and logged-out visitors see an upgrade card in place of the chain
- Open interest reflects the prior close; volume and IV are session data
- A row with
0implied volatility usually means the contract has not traded recently - Greeks in the Strategy Builder are model-estimated (fixed ~30-day/30%-IV model) and are not sourced from live market data; Greeks in the chain are per contract
- Strategy Builder shares one modeled expiry and IV across legs — calendars and diagonals are approximations, not full models
- The chain lists the expirations the exchange offers, so some names have only a few dates
TROUBLESHOOTING¶
| Problem | Fix |
|---|---|
| Upgrade card shows instead of the chain | The live chain needs Pro. See Pricing. |
| No options for a ticker | It may not have listed options. |
| A table looks short on a phone | Turn the phone sideways or use a wider screen to see all columns. |
| The payoff chart is empty | Add at least one leg in the Strategy Builder. |