§03 MARKET_HEATMAP¶
OVERVIEW¶
The Heatmap renders the top S&P 500 stocks as a cap-weighted grid, grouped by GICS sector and then by industry within each sector, coloured by % change. Box area is market cap. Box colour is the period return for the selected time range. Click a sector header to drill into that sector's top scanner rows in a slide-out panel.
Path: /heatmap · Sidebar: MARKETS group

WHAT IT IS¶
The heatmap shows the whole market at a glance. Each box is a stock. Big companies get big boxes. Green boxes are up, red boxes are down, and the brighter the color, the bigger the move. Stocks sit inside their sector and industry, so you can see which part of the market is carrying the day.
HOW TO READ THE S&P 500 HEATMAP¶
Click Heatmap in the left menu. It opens on S&P 500 with Today colors.
- Find the big boxes first, such as the largest tech names. They move the index.
- Look at the color of each sector block. A mostly green sector means money is flowing in.
- Check the legend at the bottom for the color scale.
- Click any stock box to open its research page.
The map shows the 60 largest companies in the view and refreshes about every minute.
HOW TO LOOK INSIDE A SECTOR¶
- Click a sector name, such as TECHNOLOGY, on a computer.
- A panel slides in from the right with the sector's top 10 movers by % change.
- Click a row to open that stock, or close the panel with its X.
On a phone, tap a stock to open it. The sector panel is a computer feature.
HOW TO CHANGE THE TIME RANGE (PRO)¶
Use the range buttons at the top: Today, 1W, 1M, 3M, 6M, YTD and 1Y.
A stock that is red today but green over a year is a pullback. Red on both is a stock in trouble.
Free accounts see Today only. The other ranges show a lock.
HOW TO SWITCH TO SECTORS OR CRYPTO (PRO)¶
Click Sector ETFs to see the eleven sectors as ETFs.
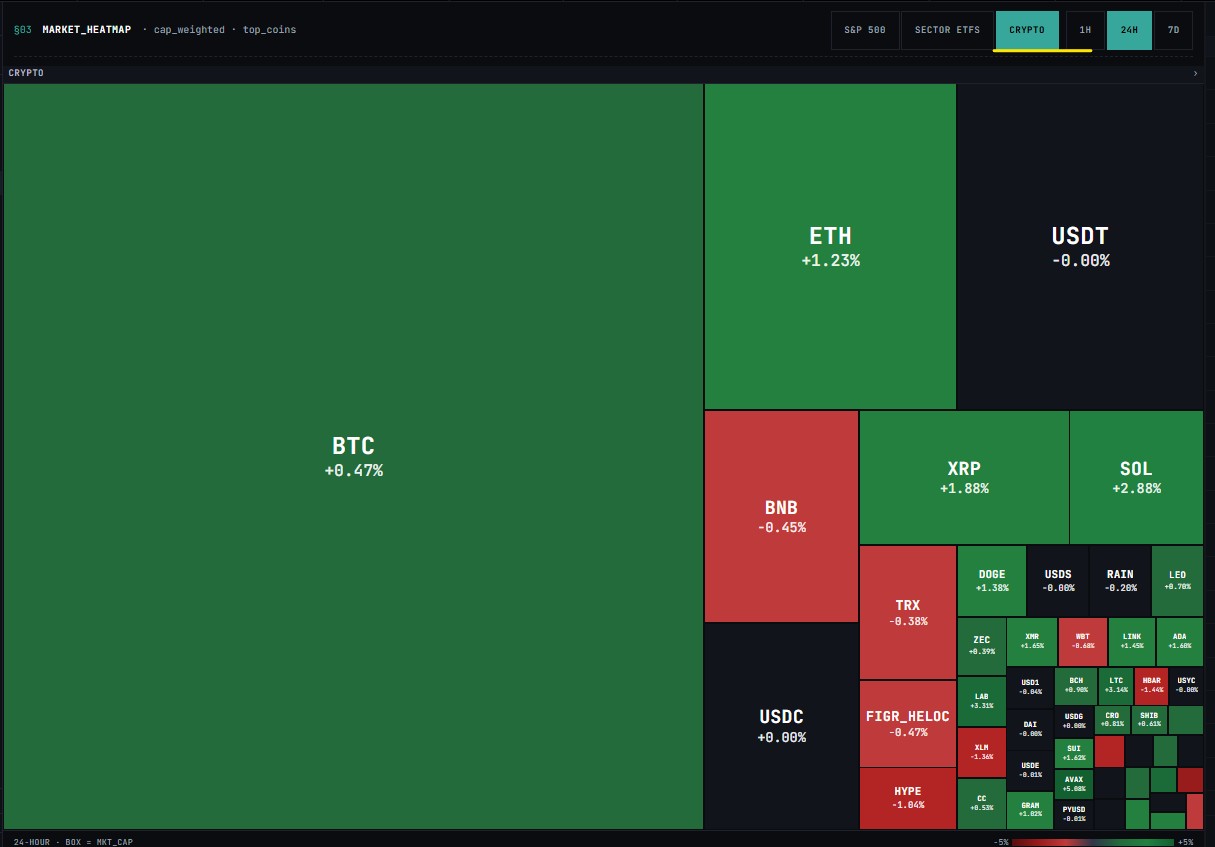
Click Crypto for a coin map. It has its own ranges, 1H, 24H and 7D.
Free accounts see S&P 500. The other views show a lock and a note that they are Pro views.
S&P 500¶

Sector ETFs¶

Crypto¶
CONTROLS¶
| Control | Values | Notes |
|---|---|---|
| View | S&P 500, Sector ETFs, Crypto | Pro unlocks Sector ETFs and Crypto; Free is locked to S&P 500 |
| Time range (equities) | Today, 1W, 1M, 3M, 6M, YTD, 1Y | Sets the period the colour represents. Pro unlocks every range past Today; Free is locked to Today |
| Time range (crypto) | 1H, 24H, 7D | Pro only |
Colour scale (% change)¶
| Range | Colour |
|---|---|
| ≤ −5% | #5B0E0E (deep red) |
| −5% to −3% | #7A1515 |
| −3% to −2% | #9B1C1C |
| −2% to −1% | #B72525 |
| −1% to −0.3% | #C43A3A |
| −0.3% to +0.3% | #11141a (neutral slate) |
| +0.3% to +1% | #1E6B3A |
| +1% to +2% | #1A7F3A |
| +2% to +3% | #15803D |
| +3% to +5% | #0F6B35 |
| ≥ +5% | #065F2E (deep green) |
Per-tile data (tooltip and drill)¶
| Field | Description |
|---|---|
symbol |
Ticker |
name |
Company name |
sector |
One of 11 GICS sectors (Technology, Communication, Consumer Cyclical, Healthcare, Financial, Consumer Defensive, Industrial, Energy, Utilities, Real Estate, Basic Materials) |
industry |
GICS industry within the sector (e.g., Semiconductors, Banks—Diversified) — drives the in-sector sub-headers |
marketCap |
Last price × shares outstanding |
changePercent |
Today: the live session percent change; 1W/1M/3M/6M/YTD/1Y: computed from the close at the matching lookback (≈5 / 21 / 63 / 126 trading days, first-of-year, and ~252 days) |
price |
Last price |
volume |
Session total volume |
Note
The hover tooltip surfaces sector, industry, market cap, price, and the % change for the active time range.
GOOD TO KNOW¶
Box size is market cap and color is the percentage move. A big box that moves 1% matters more to the index than a small box that moves 5%.
Use the heatmap first, then Movers or the Scanner to find individual names.
IF SOMETHING DOESN'T WORK¶
The map is empty or slow: it can take a moment on the first load. Reload the page.
A view is locked: Sector ETFs, Crypto and the longer ranges are Pro. Free accounts keep S&P 500 and Today.