§02 CHARTS - DATA WINDOW¶
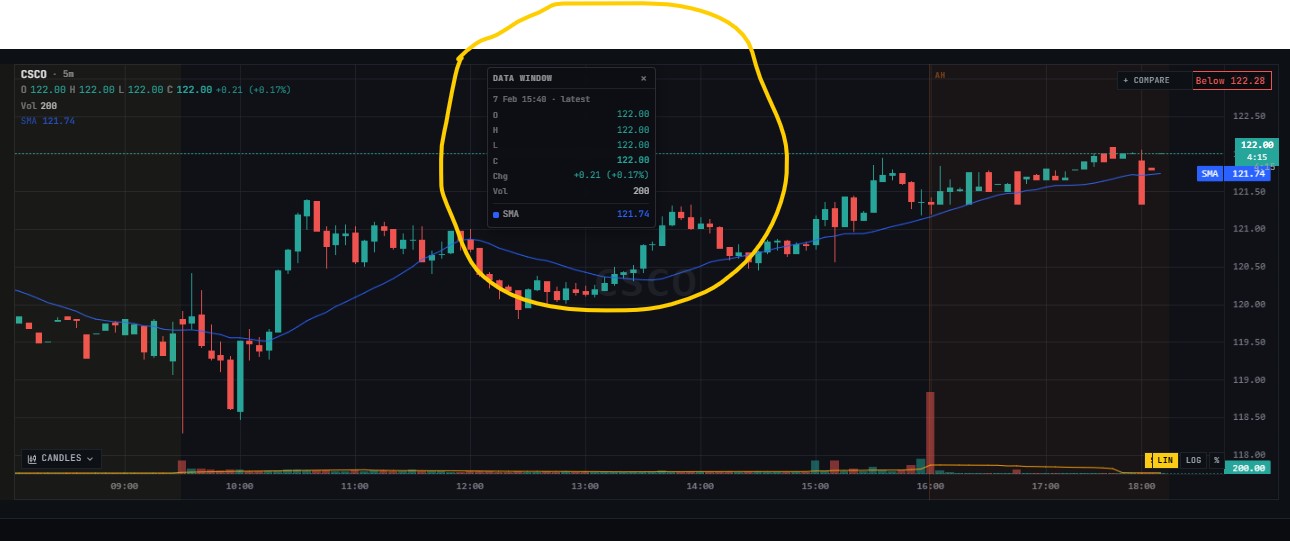
The Data Window is the small box on your chart that shows the exact numbers for the candle you are pointing at or the latest candle.
Data Window Guide for Stock Charts¶
What is the Data Window?¶
The Data Window is the small information box on your chart that shows the exact data for the candle you are hovering over or selecting.
Instead of guessing prices from the chart, the Data Window gives you the exact numbers for that candle.
In your chart, the Data Window is showing data for SLMT on the 5-minute timeframe.
What Each Field Means¶
| Field | Meaning |
|---|---|
| O | Open price: the price where the candle started |
| H | High price: the highest price reached during that candle |
| L | Low price: the lowest price reached during that candle |
| C | Close price: the price where the candle ended, or current price if the candle is still active |
| Chg | Price change compared with the previous close or previous candle |
| Vol | Volume: how many shares/contracts traded during that candle |
| SMA | Simple Moving Average value from the blue SMA line |
Example From Your Image¶
Your Data Window shows approximately:
| Field | Value |
|---|---|
| Open | 6.38 |
| High | 6.38 |
| Low | 6.38 |
| Close | 6.38 |
| Change | -0.09 / -1.39% |
| Volume | 1.2K |
| SMA | 6.49 |
This means the selected candle is trading around $6.38, down about 1.39%, with about 1,200 volume. The SMA is around $6.49.
Because the price is below the SMA, the chart may be showing short-term weakness at that moment.
How It Works¶
The Data Window updates when you move your mouse across the chart.
If you hover over a candle, it shows that candle's exact:
- Open
- High
- Low
- Close
- Volume
- Indicator values
If you are using a 5-minute chart, each candle represents 5 minutes of price action.
If the latest candle is still forming, the numbers can continue changing until the candle closes.
How to Read a Candle Using the Data Window¶
Green Candle¶
A green candle usually means:
Example:
That means the price moved up during that candle.
Red Candle¶
A red candle usually means:
Example:
That means the price moved down during that candle.
How to Use the Data Window¶
1. Check Exact Entry and Exit Prices¶
Use the Data Window to see exact prices instead of guessing from the chart.
Example:
2. Compare Price With SMA¶
In your image:
Price is below the SMA, which can suggest weakness.
If price moves above the SMA, it may show stronger momentum.
3. Check Volume¶
Volume tells you how much activity happened during the candle.
Higher volume means more traders are involved.
Example:
Price up + high volume = stronger move
Price up + low volume = weaker move
Price down + high volume = strong selling pressure
4. Study Previous Candles¶
Move your mouse over older candles to compare:
- Where the move started
- Where buyers stepped in
- Where sellers pushed price down
- Whether volume increased or decreased
Important Reminder¶
The Data Window is not a buy or sell signal by itself.
It is a tool that helps you read the chart more accurately.
Use it together with:
- Trend direction
- Support and resistance
- Volume
- Moving averages
- Risk management
Simple Trading Checklist¶
Before making a trade, check:
1. What is the current price?
2. Is price above or below the SMA?
3. Is volume increasing?
4. Where is support?
5. Where is resistance?
6. What is my stop loss?
7. What is my target?
Quick Summary¶
The Data Window helps you see the exact candle data.
It shows:
Use it to understand what happened during each candle and to make better chart-reading decisions.