§02 CHARTS - Scale¶
This document details the options available under the SCALE submenu from the trading platform interface shown in the image.
Scale Submenu Overview¶
The SCALE menu controls how price data is plotted vertically on the chart's Y-axis and how the price scaling behaves during navigation or adjustments.
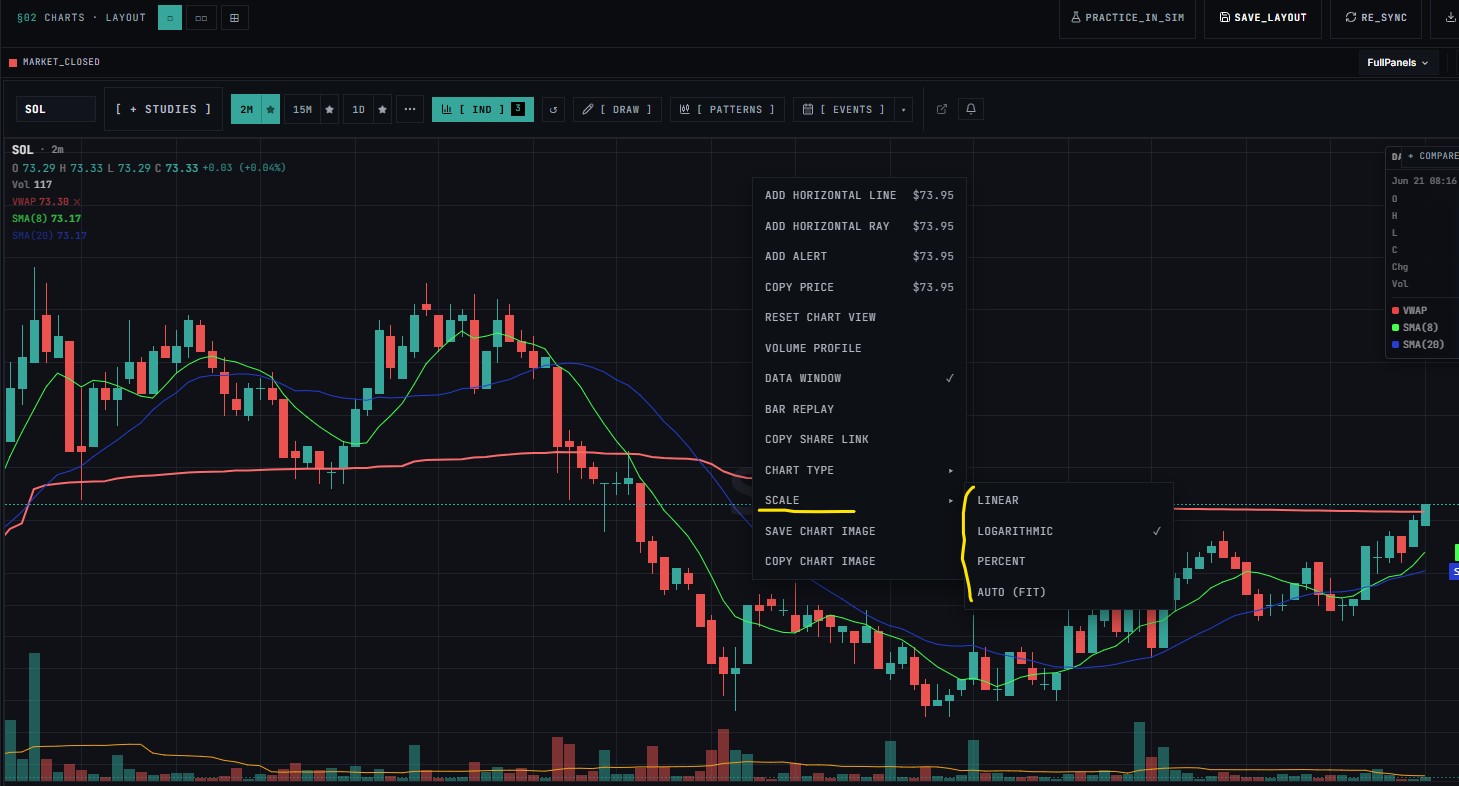
1. LINEAR¶
- Description: Scales the Y-axis using equal absolute price distances.
- Behavior: A price movement from $10 to $20 occupies the exact same vertical distance on the chart as a movement from $100 to $110 (both are an absolute difference of $10).
- Best Used For: Short-term trading, intraday charting, or assets with tight/stable price ranges where raw dollar movements matter most.
2. LOGARITHMIC (Selected)¶
- Description: Scales the Y-axis based on percentage changes rather than absolute dollar changes.
- Behavior: A price movement from $10 to $20 (a 100% increase) will look much larger than a movement from $100 to $110 (a 10% increase), even though the absolute dollar change is the same.
- Best Used For: Long-term charting, highly volatile assets (like cryptocurrencies or growth stocks), or macro analysis where proportional percentage growth is more meaningful than fixed dollar amounts.
3. PERCENT¶
- Description: Transforms the Y-axis from absolute asset prices into percentage changes relative to a specific reference point on the chart.
- Behavior: The starting point of the selected view or a specific day is set to 0%, and subsequent price movements are shown as $+X\%$ or $-Y\%$.
- Best Used For: Comparing the performance of multiple assets simultaneously or measuring exact percentage returns directly from the axis grid.
4. AUTO (FIT)¶
- Description: Automatically scales and adjusts the vertical axis based on the visible data on the screen.
- Behavior: As you scroll horizontally back and forth through time, the scale dynamically stretches or compresses vertically so that the highest highs and lowest lows of the current view fit perfectly within the screen boundaries.
5. BASELINE¶
- Description: Establishes a horizontal baseline value on the chart.
- Behavior: Shades or colors the chart differently depending on whether the asset price is trading above or below this chosen baseline level (often used to visualize gains vs. losses relative to an entry or reference price).
6. RENKO¶
- Description: Configures or toggles custom brick-based price filtering independent of traditional time intervals.
- Behavior: Draws a new block only when price moves by a predefined fixed amount, filtering out minor price noise and focusing strictly on directional trend shifts.
7. RANGE¶
- Description: Changes chart construction to be based strictly on standard or custom high-to-low price intervals.
- Behavior: Each price bar spans a fixed price range specified by the user (e.g., a 1-point range bar), regardless of how much time passes.
8. LINE BRACK / LINE BREAK¶
- Description: Utilizes multi-line reversal charting styles (commonly 3-Line Break).
- Behavior: Adds lines only when the closing price breaks above or below a specified number of previous lines, highlighting key underlying trend reversals.