§000 SCANNER - ADD PANEL - # inside the panel selected¶
This fselectiona the dropdown INSIDE a scanner panel only switches wich scanner thet one panel show.¶

Full Menu by Section¶
Pre-Market / Momentum¶
Scanners focused on fast-moving stocks, morning gaps, and intra-day momentum.
- PRE-MARKET GAP UP¶

Category: Momentum & Gappers
Description & Usage: Stocks trading higher before the market opens compared with the previous close. Used to find early bullish attention. Confirm volume, news catalyst, and whether price holds above key levels after the open.
Stocks opening significantly higher than their previous close.
- PRE-MARKET RUNNERS¶

Category: Momentum & Gappers
Description & Usage: Stocks already moving strongly upward during pre-market hours. Useful for building a morning watchlist. Be careful of thin liquidity and wide spreads before the open.
Stocks with high momentum and volume before the market opens.
- PRE-MARKET GAP DOWN¶
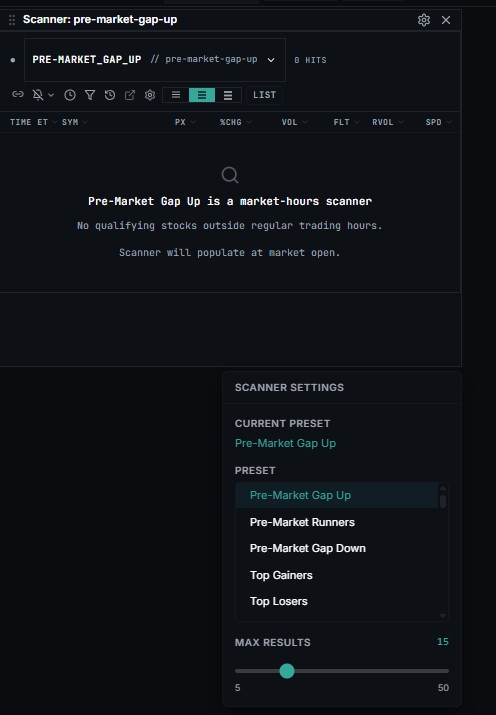
Category: Momentum & Gappers
Description & Usage: Stocks trading lower before the market opens compared with the previous close. Used to find bearish setups, panic selling, or possible bounce/reversal candidates. Check catalyst and support levels.
Stocks opening significantly lower than their previous close.
- TOP GAINERS¶

Category: Momentum & Gappers
Description & Usage: Stocks with the largest percentage gains over a selected period. Helps identify strong momentum. Watch for overextension and sudden profit-taking.
Currently showing the highest percentage gain for the day.
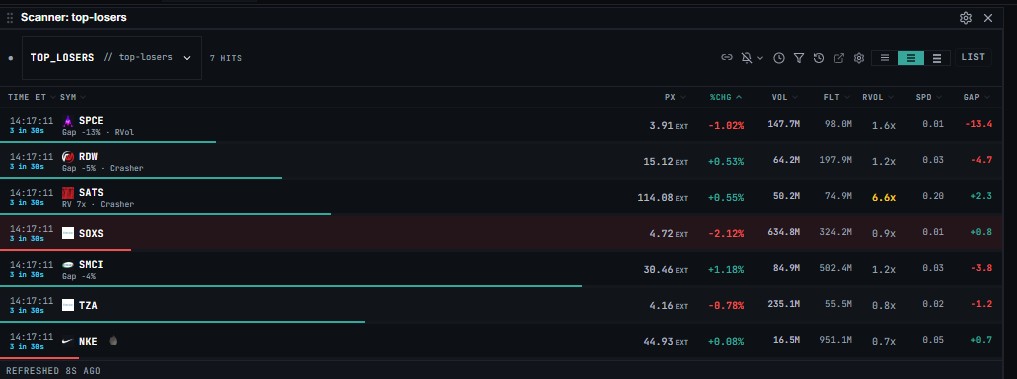
- TOP LOSERS¶
Category: Momentum & Gappers
Description & Usage: Stocks with the largest percentage losses over a selected period. Helps identify selloff candidates or possible oversold bounce setups.
Currently showing the highest percentage loss for the day.
- HOD MOMENTUM¶

Category: Momentum & Gappers
Description & Usage: Stocks pushing toward or making new highs of the day. Often used for breakout continuation trades. Confirm volume expansion and avoid chasing late moves.
Stocks pushing towards or breaking their High of Day.
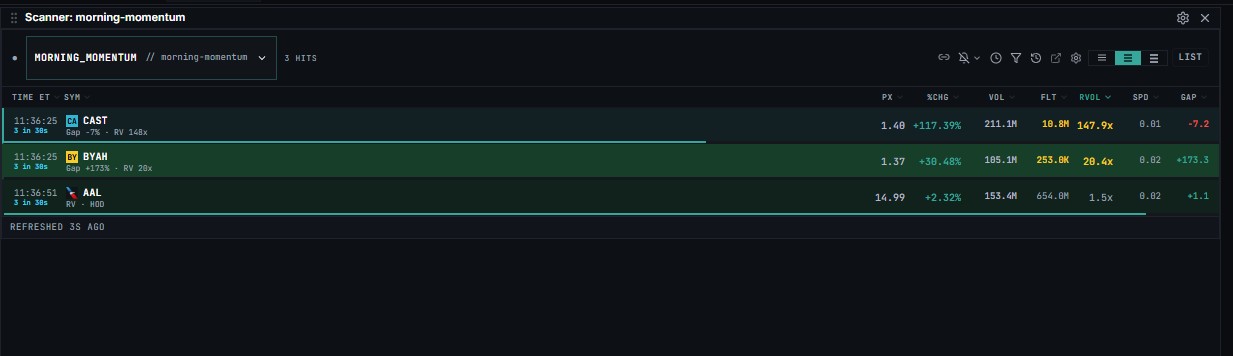
- MORNING MOMENTUM¶
Category: Momentum & Gappers
Description & Usage: Stocks showing strong early-session movement. Useful during the first part of the trading day when volume and volatility are high. Risk is higher due to fast moves.
Stocks showing strong directional moves shortly after the open.
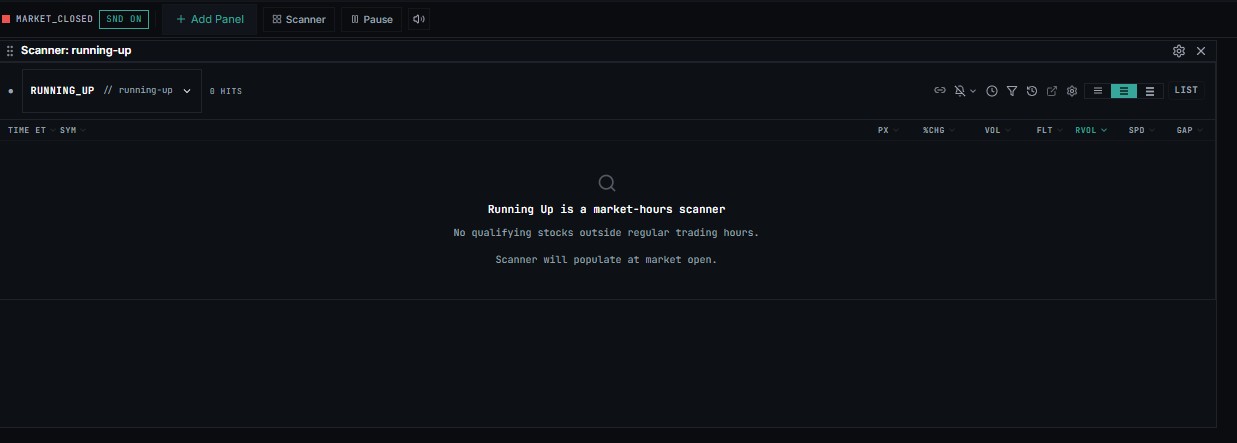
- RUNNING UP¶
Category: Momentum & Gappers
Description & Usage: Stocks trending upward intraday. Helps locate active bullish trend names. Look for pullbacks, VWAP support, or clean breakout structures.
Stocks currently in an active upward trend.
- POWER HOUR SURGE¶

Category: Momentum & Gappers
Description & Usage: Stocks gaining momentum near the final trading hour. Used for late-day continuation ideas. Confirm closing volume and avoid low-volume spikes.
Stocks showing strong momentum in the final hour of trading.
- FLOAT ROTATION¶

Category: Momentum & Gappers
Description & Usage: Stocks where volume is high relative to the public float. Indicates heavy turnover. Especially important for low-float stocks, which can be volatile and prone to squeezes.
Stocks where the trading volume is turning over the available float rapidly.
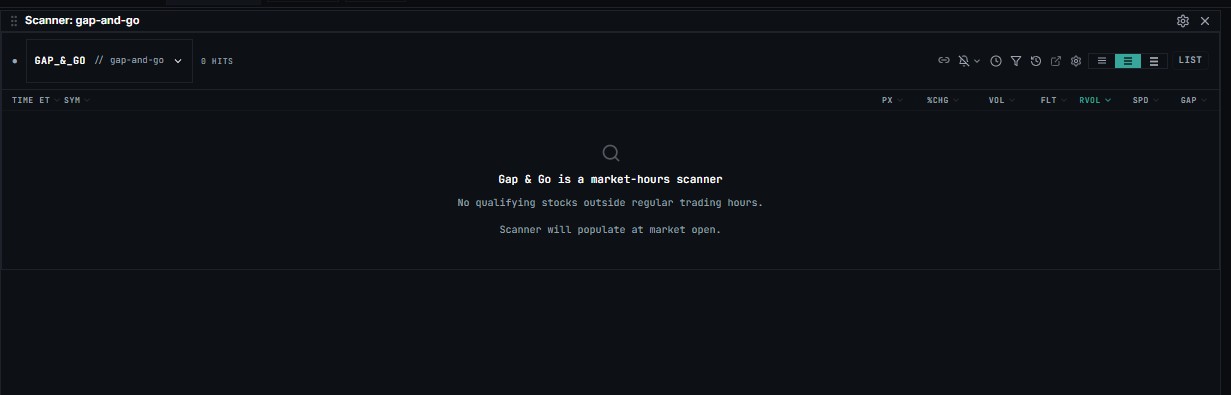
- GAP & GO¶
Category: Momentum & Gappers
Description & Usage: Stocks that gap up and continue moving higher after the open. Classic momentum setup. Best when supported by news, relative volume, and strong price action above VWAP.
Stocks that gapped up and continue to drive higher at the open.
Bearish & Shorts¶
Scanners designed to find weak stocks or potential short-selling opportunities.
- HOD BREAKDOWN¶

Category: Bearish & Shorts
Description & Usage: Stocks failing after reaching or attempting the high of day. Can signal momentum exhaustion or short setup. Confirm lower highs, failed breakouts, and volume shift.
Stocks failing at their High of Day and reversing downward.
- HIGH SHORT INTEREST¶

Category: Bearish & Shorts
Description & Usage: Stocks with a large portion of shares sold short. Useful for both short-bias research and squeeze watchlists. High short interest can increase volatility in either direction.
Stocks with a large percentage of their float sold short.
- GAP DOWN¶

Category: Bearish & Shorts
Description & Usage: Stocks opening below the previous close. Used to identify weakness, bearish catalysts, or potential reversal bounces. Context matters: news, volume, and support zones.
Stocks opening lower, continuing downward momentum.
- UNUSUAL VOLUME LOSERS¶

Category: Bearish & Shorts
Description & Usage: Stocks falling with unusually high trading volume. Can indicate institutional selling, negative news, or panic. Useful for bearish continuation or oversold bounce monitoring.
Stocks dropping in price on significantly higher than normal volume.
- UNUSUAL VOLUME¶

Category: Volume-Based
Description & Usage: Stocks trading much more volume than normal. Volume often confirms attention. Combine with price direction, catalyst, and relative volume.
Stocks trading well above their average daily volume.
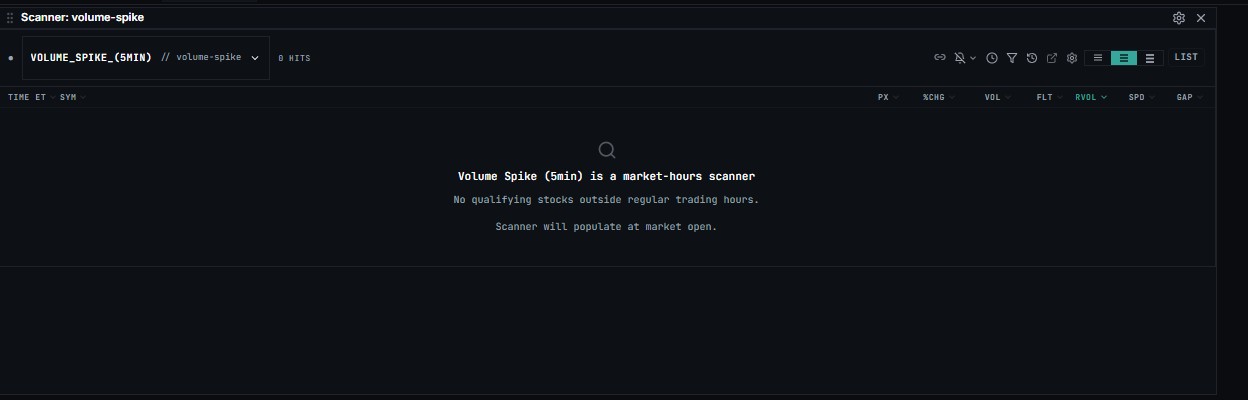
- VOLUME SPIKE (5MIN)¶
Category: Volume-Based
Description & Usage: Stocks with a sudden burst of volume over a five-minute window. Useful for detecting news reactions, breakouts, halts, or sudden momentum shifts. Requires quick confirmation.
Sudden bursts of volume within a 5-minute window.
- HIGH VOLUME BREAKOUT¶

Category: Volume-Based
Description & Usage: Stocks breaking above a key level with strong volume. Often stronger than low-volume breakouts. Watch for failed breakouts and retests.
Stocks breaking through key levels with strong volume support.
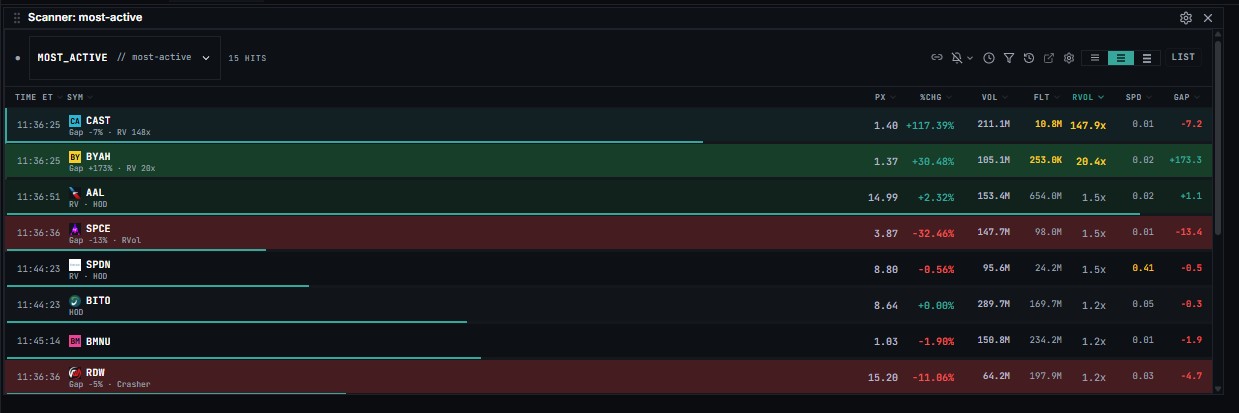
- MOST ACTIVE¶
Category: Volume-Based
Description & Usage: Stocks with the highest share volume or activity. Helps locate liquid names. High activity alone is not bullish or bearish; combine with direction and catalyst.
Stocks with the highest total share volume traded today.
- RELATIVE VOLUME¶

Category: Volume-Based
Description & Usage: Stocks trading higher volume compared with their normal average. A strong attention signal. High relative volume can validate momentum, news, or unusual accumulation/distribution.
Stocks with high volume relative to their historical time-of-day averages.
Price Action & Technicals¶
Scanners based on technical indicators, chart levels, and price behavior.
- NEAR 52-WEEK HIGH¶

Category: Price Action & Technicals
Description & Usage: Stocks close to their highest price in the past year. Can show long-term strength and breakout potential. Watch for resistance and profit-taking near highs.
Stocks approaching their highest price in the last year.
- NEAR 52-WEEK LOW¶

Category: Price Action & Technicals
Description & Usage: Stocks close to their lowest price in the past year. Can show weakness, capitulation, or possible value/reversal candidates. Avoid assuming cheap means safe.
Stocks approaching their lowest price in the last year.
- OVERSOLD (RSI < 30)¶

Category: Price Action & Technicals
Description & Usage: Stocks with RSI below 30. May indicate stretched downside momentum. Oversold can stay oversold, so look for confirmation before reversal trades.
Stocks that may be undervalued or due for a bounce based on the Relative Strength Index.
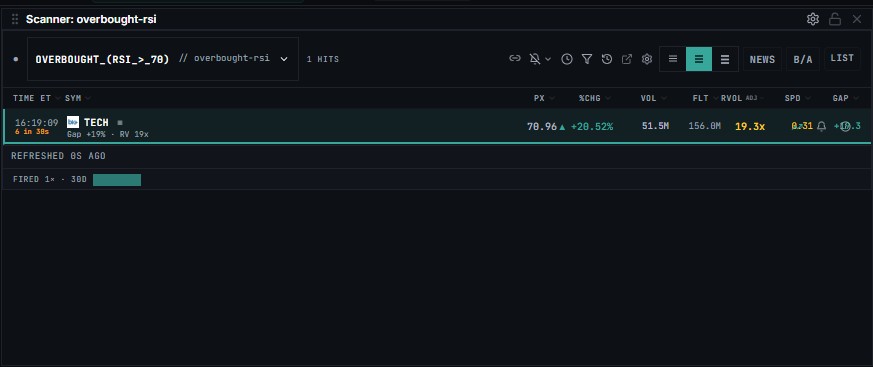
- OVERBOUGHT (RSI > 70)¶
Category: Price Action & Technicals
Description & Usage: Stocks with RSI above 70. May indicate strong momentum or possible overextension. Overbought is not automatically a short signal.
Stocks that may be overextended based on the Relative Strength Index.
- ABOVE VWAP¶

Category: Price Action & Technicals
Description & Usage: Stocks trading above intraday VWAP. Often considered bullish intraday positioning. Traders may use VWAP as support or trend confirmation.
Stocks trading above their Volume Weighted Average Price, generally considered bullish.
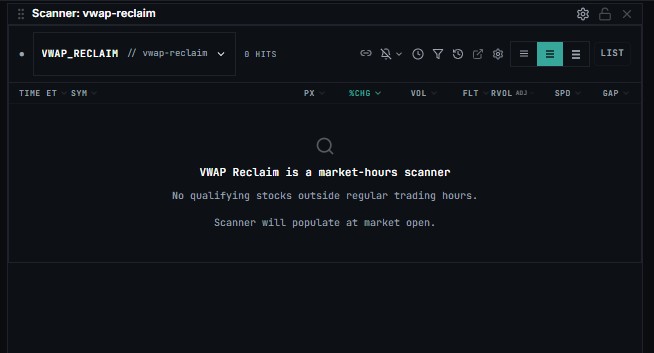
- VWAP RECLAIM¶
Category: Price Action & Technicals
Description & Usage: Stocks that fell below VWAP and then moved back above it. Can signal a bullish shift or recovery. Stronger when reclaim happens with volume and holds on retest.
Stocks crossing back above the VWAP line after trading below it.
- REVERSAL CANDIDATES¶

Category: Price Action & Technicals
Description & Usage: Stocks showing signs of changing direction. Used to find possible trend turns. Confirm with support/resistance, candles, volume, and market context.
Stocks showing signs of a trend change (e.g., bottoming tails, topping wicks).
- OPENING RANGE BREAKOUT¶

Category: Price Action & Technicals
Description & Usage: Stocks breaking above the high of the early-session opening range. Common day-trading setup. Define the opening range and manage risk below breakout or VWAP.
Stocks breaking out of the high or low established in the first few minutes of trading.
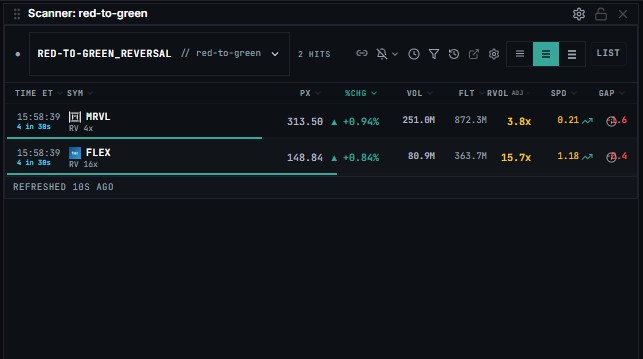
- RED-TO-GREEN REVERSAL¶
Category: Price Action & Technicals
Description & Usage: Stocks that were down on the day and then turn positive. Often watched as a bullish momentum shift. Stronger when combined with volume and reclaim of key levels.
Stocks that opened lower (red) but have pushed up to turn positive (green) for the day.
Market Cap Specific¶
Scanners filtering stocks by their total market valuation.
- LARGE CAP MOVERS¶

Category: Market Cap Specific
Description & Usage: Large-cap stocks making notable moves. Usually more liquid and less volatile than small caps. Useful for cleaner technical setups and options liquidity.
Highly capitalized companies showing significant price action.
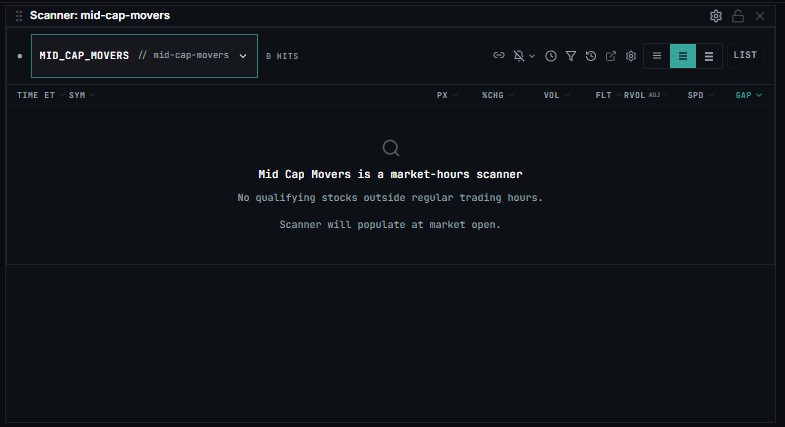
- MID CAP MOVERS¶
Category: Market Cap Specific
Description & Usage: Mid-cap stocks with notable price movement. Can offer a balance between liquidity and volatility. Confirm spread and volume before trading.
Medium-sized companies with notable movement.
- SMALL CAP ROCKETS¶

Category: Market Cap Specific
Description & Usage: Small-cap stocks making sharp upward moves. High reward/high risk. Often catalyst-driven and volatile; position sizing and risk control are important.
Smaller companies experiencing rapid, explosive price increases.
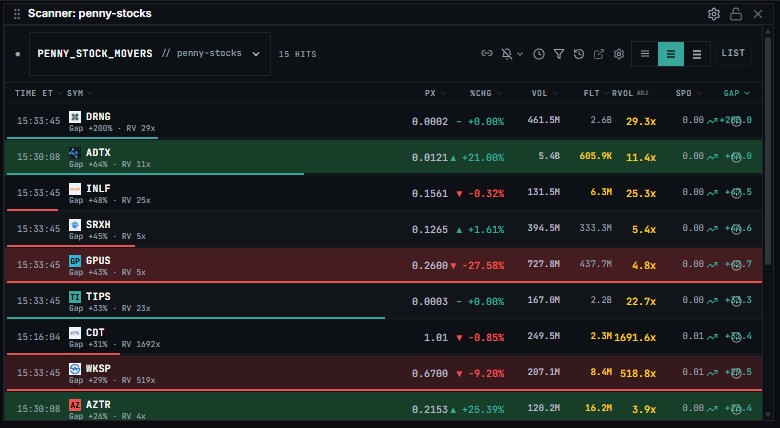
- PENNY STOCK MOVERS¶
Category: Market Cap Specific
Description & Usage: Low-priced penny stocks with notable movement. Very speculative. Watch liquidity, spreads, dilution risk, halts, and news quality.
Very low-priced stocks (usually under $5) showing high activity.
- SUB-$1 RUNNERS¶

Category: Market Cap Specific
Description & Usage: Stocks under $1 moving sharply. Extremely risky and volatile. Often prone to compliance/news-driven moves, large spreads, and sudden reversals.
Micro-cap stocks trading under a dollar with high momentum.
- MICROCAP MOMENTUM¶
Category: Market Cap Specific
Description & Usage:
Specialty Scanners¶
Scanners focused on specific catalysts, events, or unique market situations.
- SECTOR MOMENTUM¶
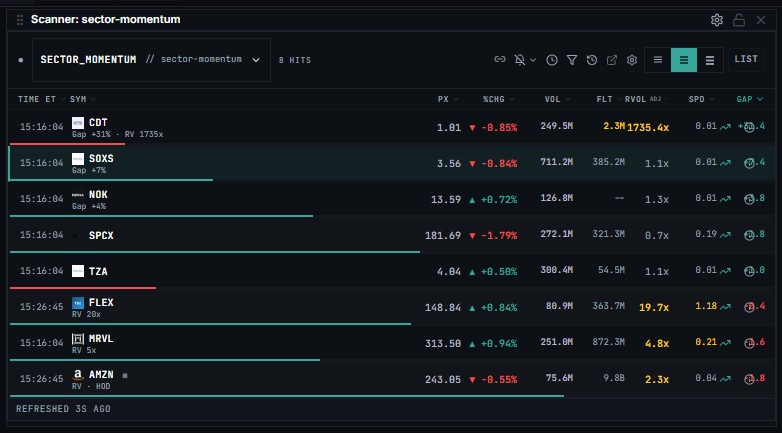
Category: Specialty Scanners
Description & Usage: Stocks moving with strength in a specific sector/theme. Useful for finding sympathy plays and sector-wide momentum. Confirm whether the move is broad or isolated.
Whole industries or sectors moving together.
- LOW FLOAT RUNNERS¶

Category: Specialty Scanners
Description & Usage: Low-float stocks moving strongly. Can move quickly because fewer shares are available. High risk of squeezes, halts, and sharp reversals.
Stocks with a small number of tradable shares that are moving rapidly.
- AFTER-HOURS MOVERS¶
Category: Specialty Scanners
Description & Usage: Stocks moving after the regular market close. Often tied to earnings, news, or filings. Liquidity is lower and spreads can be wider after hours.
Stocks with significant action in the extended trading session.
- BREAKING NEWS MOVERS¶
Category: Specialty Scanners
Description & Usage: Stocks reacting to fresh news. Useful for catalyst-based momentum. Speed matters, but verify the news source and avoid chasing headlines blindly.
Stocks reacting to fresh press releases or news headlines.
- HIGH SHORT INTEREST SQUEEZE¶
Category: Specialty Scanners
Description & Usage: Highly shorted stocks showing squeeze-like upward movement. Can rise quickly as shorts cover. Risk is extreme; watch float, volume, borrow dynamics, and resistance levels.
Heavily shorted stocks that are squeezing higher, forcing shorts to cover.
- IPO WATCH¶
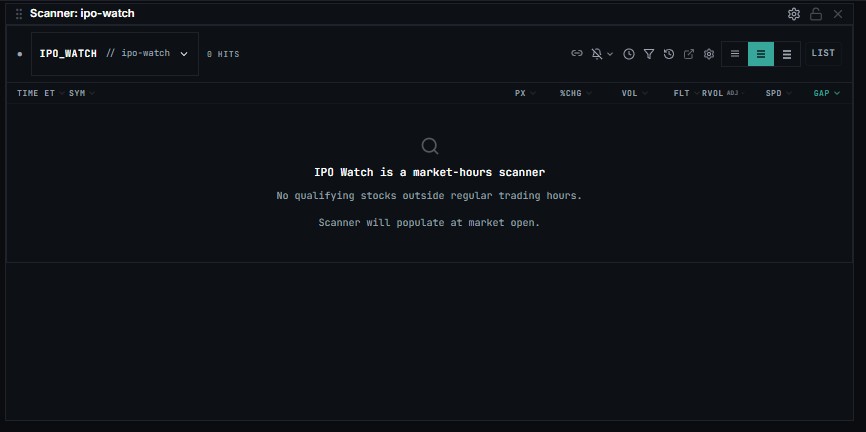
Category: Specialty Scanners
Description & Usage: Recently listed or upcoming IPO-related stocks. IPOs can be volatile due to limited trading history and uncertain support/resistance. Watch lockups and news.
Recently listed Initial Public Offerings.
- FORMER RUNNERS¶

Category: Specialty Scanners
Description & Usage: Stocks that previously made big moves. Prior runners can move again when volume/news returns. Useful for watchlists, but many fade after the original catalyst.
Stocks with a history of massive historical moves that are active again.
- HALT RESUME¶
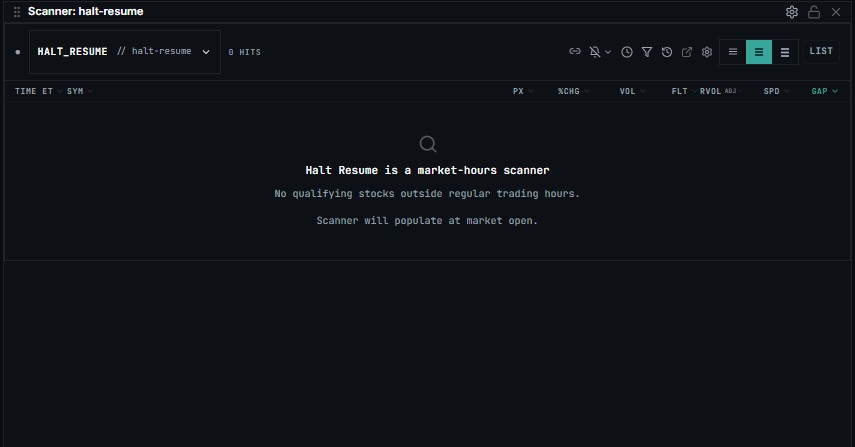
Category: Specialty Scanners
Description & Usage: Stocks resuming trading after a halt. Very volatile. Watch halt reason, reopening price, spread, and liquidity before entering.
Stocks that were paused for volatility/news and are resuming trading.
- TOP CRYPTO MOVERS 24H ← CURRENT¶

Category: Crypto (24/7) Description & Usage: Top crypto assets sorted by 24h % change – live 24/7 via CoinGecko
NOT ACTIVE PANEL ANYMORE¶
- EARNINGS MOVERS¶

Category: Specialty Scanners
Description & Usage: Stocks moving after earnings reports or guidance updates. Earnings can create strong gaps and volatility. Review revenue, EPS, guidance, and market reaction.
Stocks reacting to recent quarterly earnings reports.
- REVENUE SURPRISES¶

Category: Specialty Scanners
Description & Usage: Companies reporting revenue significantly above or below expectations. Revenue surprises can drive repricing. Compare revenue reaction with earnings, margins, and guidance.
Stocks reacting to unexpected revenue beats or misses.
- BLOCK TRADES¶

Category: Specialty Scanners
Description & Usage: Large negotiated trades or unusually large share transactions. May suggest institutional activity. Interpret carefully because block trades can be buys, sells, or transfers.
Stocks where unusually large, single trades (institutions/whales) are detected.
Paper Trading¶

Category: Workspace Tools
Description & Usage: Simulated trading mode using real-time live data.
AI Assistant¶

Category: Workspace Tools
Description & Usage: Integrated tool to help answer platform questions or analyze stocks.
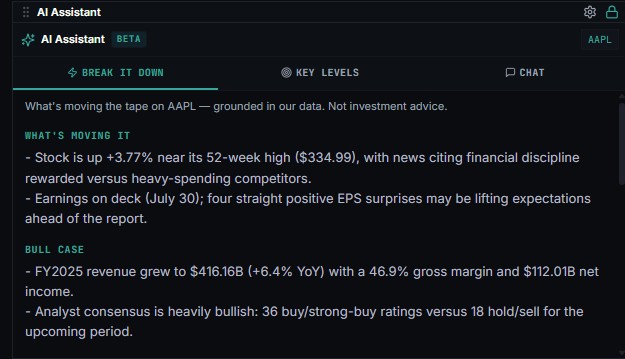
Break It Down¶
What's moving the tape on AAPL — grounded in our data. Not investment advice.
Key Levels¶
The key technical levels for AAPL — support, resistance, range & volume — grounded in our data. Not investment advice.

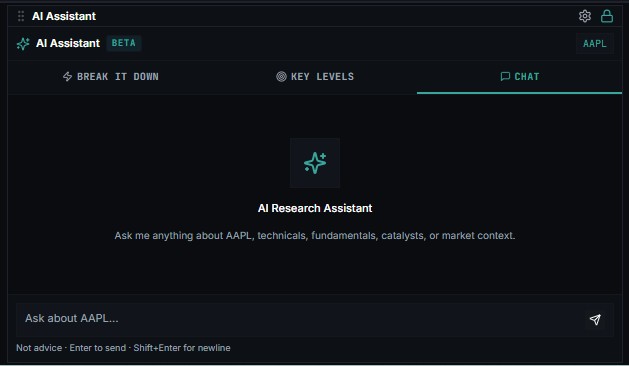
Chat¶
Ask me anything about AAPL, technicals, fundamentals, catalysts, or market context.
28 June Master Merged Specification Table¶
Trading Scanners Criteria Reference Guide¶
| Category | Scanner Name | Description / Criteria |
|---|---|---|
| Pre-Market / Momentum | PRE-MARKET GAP UP | Stocks gapping up >3% in pre-market with volume |
| Pre-Market / Momentum | PRE-MARKET RUNNERS | Low-float small-caps gapping >4% with RVOL >5 – the small-cap runner setup |
| Pre-Market / Momentum | PRE-MARKET GAP DOWN | Stocks gapping down >3% in pre-market |
| Pre-Market / Momentum | TOP GAINERS | Biggest % gainers today with significant volume |
| Pre-Market / Momentum | TOP LOSERS | Biggest % losers today with significant volume |
| Pre-Market / Momentum | HOD MOMENTUM | Stocks hitting new highs of day with strong momentum |
| Pre-Market / Momentum | MORNING MOMENTUM | Top movers in the first hour of trading |
| Pre-Market / Momentum | RUNNING UP | Stocks actively making new highs with high trigger frequency – real-time momentum |
| Pre-Market / Momentum | POWER HOUR SURGE | Stocks surging in the last hour of trading |
| Pre-Market / Momentum | FLOAT ROTATION | Volume has exceeded the total tradeable float – extreme turnover |
| Pre-Market / Momentum | GAP & GO | Premarket gap >5% on low float with 3x+ relative volume – the classic Gap & Go setup |
| Bearish & Shorts | HOD BREAKDOWN | Stocks breaking down near day low |
| Bearish & Shorts | HIGH SHORT INTEREST | Stocks with high short interest as % of float |
| Bearish & Shorts | GAP DOWN | Stocks gapping down >3% from previous close |
| Bearish & Shorts | UNUSUAL VOLUME LOSERS | Losers with unusually high relative volume |
| Volume-Based | UNUSUAL VOLUME | Stocks trading >2x their average volume |
| Volume-Based | VOLUME SPIKE (5MIN) | Stocks with 3x+ volume spike in last 5 minutes |
| Volume-Based | HIGH VOLUME BREAKOUT | Stocks up >1% on >1.5x volume near 52w high |
| Volume-Based | MOST ACTIVE | Highest absolute volume today |
| Volume-Based | RELATIVE VOLUME | Stocks with highest relative volume vs their 30-day average |
| Price Action & Technicals | NEAR 52-WEEK HIGH | Stocks within 5% of their 52-week high |
| Price Action & Technicals | NEAR 52-WEEK LOW | Stocks within 5% of their 52-week low |
| Price Action & Technicals | OVERSOLD (RSI < 30) | Stocks with RSI-14 below 30 – potential bounce candidates |
| Price Action & Technicals | OVERBOUGHT (RSI > 70) | Stocks with RSI-14 above 70 – potential reversal |
| Price Action & Technicals | ABOVE VWAP | Stocks trading above VWAP with momentum |
| Price Action & Technicals | VWAP RECLAIM | Stocks reclaiming VWAP with momentum |
| Price Action & Technicals | REVERSAL CANDIDATES | Oversold stocks showing signs of reversal |
| Price Action & Technicals | OPENING RANGE BREAKOUT | Stocks breaking above the first 15-minute opening range with volume |
| Price Action & Technicals | RED-TO-GREEN REVERSAL | Stocks that dipped below prior close then reclaimed green – intraday reversal |
| Market Cap Specific | LARGE CAP MOVERS | Large caps (>$10B) with >1% move |
| Market Cap Specific | MID CAP MOVERS | Mid caps ($2B-$10B) with significant movement |
| Market Cap Specific | SMALL CAP ROCKETS | Small caps (<$2B) with big moves and volume |
| Market Cap Specific | PENNY STOCK MOVERS | Sub-$5 stocks with high volume activity |
| Market Cap Specific | SUB-$1 RUNNERS | Stocks under $1 with explosive % moves – caught PAPL-style small-cap rips that mainstream scanners miss |
| Market Cap Specific | MICROCAP MOMENTUM | Microcaps (<$300M cap, $1-$10, low float <=15M shares) with 3x+ RVOL and >=5% move – the real catalyst setup |
| Specialty Scanners | SECTOR MOMENTUM | Top movers in a specific sector |
| Specialty Scanners | LOW FLOAT RUNNERS | Low float (<10M shares) stocks with momentum |
| Specialty Scanners | AFTER-HOURS MOVERS | Stocks with significant after-hours movement |
| Specialty Scanners | BREAKING NEWS MOVERS | Stocks moving on breaking news catalysts |
| Specialty Scanners | HIGH SHORT INTEREST SQUEEZE | High short interest stocks with squeeze potential |
| Specialty Scanners | IPO WATCH | Recently IPO'd stocks with significant movement |
| Specialty Scanners | FORMER RUNNERS | Previously big-moving stocks showing renewed activity |
| Specialty Scanners | HALT RESUME | Stocks currently halted or recently halted – classic volatility setup on resume |
| Crypto (24/7) | TOP CRYPTO MOVERS 24H ← CURRENT | Top crypto assets sorted by 24h % change – live 24/7 via CoinGecko |
Level 2 / Order Book¶

A live market-depth ladder for the selected ticker. Bids stack in green, asks in red, each row showing MMID (the market participant), Size, and depth bars sized to the largest level on each side. Between the two ladders it prints the mid price and the absolute + percentage spread. The book streams live; if no Level 2 data arrives within ~8 seconds it shows a "no data" state rather than spinning. Viewing the book is Pro (and the trial) as of 2026-06-03 — Pro, Terminal, and admin all see it. Terminal keeps the execution fence: trading against the book via the simulator's L2 walk-book fills stays Terminal-only.
Time & Sales¶

The raw print tape. Columns: Time · Price · Size · Exch · Side. Each print is colored by uptick/downtick — a print above the prior trade is tagged a buy (green), below is a sell (red), equal carries the prior side. Streams live for the active ticker only, so a scanner mover selected elsewhere won't leak into this tape. Viewing the tape is Pro and included in the trial; the paywall copy reads "Time & Sales is included with Pro ($39/mo) and the free trial."¶
Depth Chart¶

A visualization of cumulative order-book depth: the green wall is summed bid size from the inside out, the red wall is summed ask size, and they meet at the spread. It reads the same live Level 2 data as the order book, so it's the at-a-glance version of where the size sits. Viewing the depth chart is Pro — Pro, trial, Terminal, and admin all see it.
Quote¶
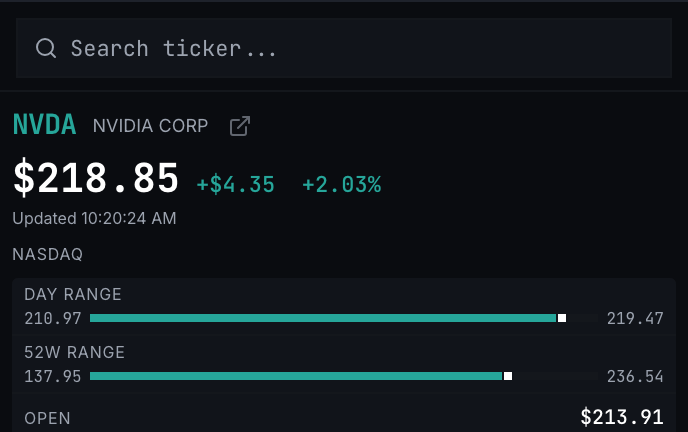
A compact ticker dashboard: last price, absolute and percent change, day range, volume, and key metrics, with an inline search to retarget the panel. It also tracks security-status changes (e.g. overnight/extended) from the live stream. The Quote panel is free — no tier gate — so it pairs with the free scanner out of the box.
Alert feed¶

A rolling log of everything that just hit a scanner trigger, newest on top. Columns: Time · Symbol · Price · %Chg · RVol · Gap%. New entries slide in and flash; halt-resume events get a yellow RESUMED tag, regular triggers a green NEW tag. Click a row to select the symbol across linked panels (on mobile it routes to Research).
A mute toggle silences its audio and Clear wipes the visible feed. Outside market hours it shows a session-aware "Scanner alerts resume when the tape reopens" state instead of a misleading "waiting" spinner.
(The Add Panel menu also lists Alerts — the rule-based price/volume alert manager covered in Alerts — distinct from this scanner-trigger feed.)
Advanced filters¶
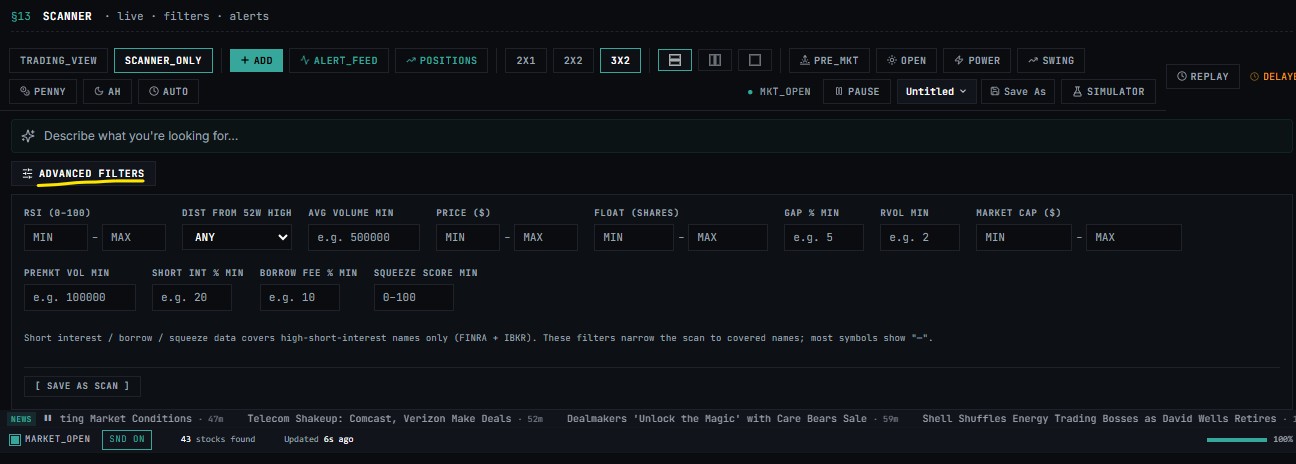
The ADVANCED FILTERS toggle chains extra constraints on top of whatever the active preset already returned — it narrows, never broadens, and runs client-side over the panel's existing result set:
Filter Range / options
RSI min and/or max, 0–100 (RSI-14) P/E RATIO min and/or max DIST FROM 52W HIGH Any / within 5% / within 10% / within 20% AVG VOLUME MIN shares floor
Replay¶

Hit REPLAY to study a past session. Pick a date (any prior trading day) and a time in ET (defaults to 09:35), and the scanner re-runs the active preset against that historical snapshot. Replay only covers dates whose sessions have been ingested into the snapshot store; the backfill runs nightly, so pick a date at least 24 hours old. Coverage is partial before April 2026.
Natural-language scan (Pro)¶
When you're on Pro or the trial, a natural-language input appears below the toolbar: describe what you want ("low-float biotechs up 10% on 5x volume") and it parses the phrase into a filter spec. If it can't parse, it prompts you to be more specific. It's hidden entirely in trading-view mode.