§01 TRADE_JOURNAL - TRADE_LOG IFT Pro Import¶
The Trade Journal serves as a professional-grade execution tracker, analytics dashboard, and performance auditing system for active traders. It supports multi-source ingestion (including direct broker sync and manual uploads), automated performance grading, and simulated vs. real execution tracking.
Export from IFTpro¶

Today's Demo Executions¶
Demo Trade History¶

File downloaded: Demo_Trade_History.csv
Demo P&L By Security¶
Demo P&L History¶
Export like CSV file
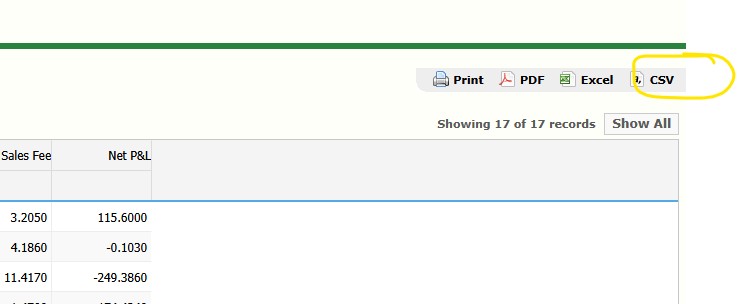
File downloaded: Demo_Trade_History.csv
Import in Tapeboard platform¶
Ensure your CSV log output is configured correctly.
Click [ IMPORT / SYNC ] on the Itoolbar.
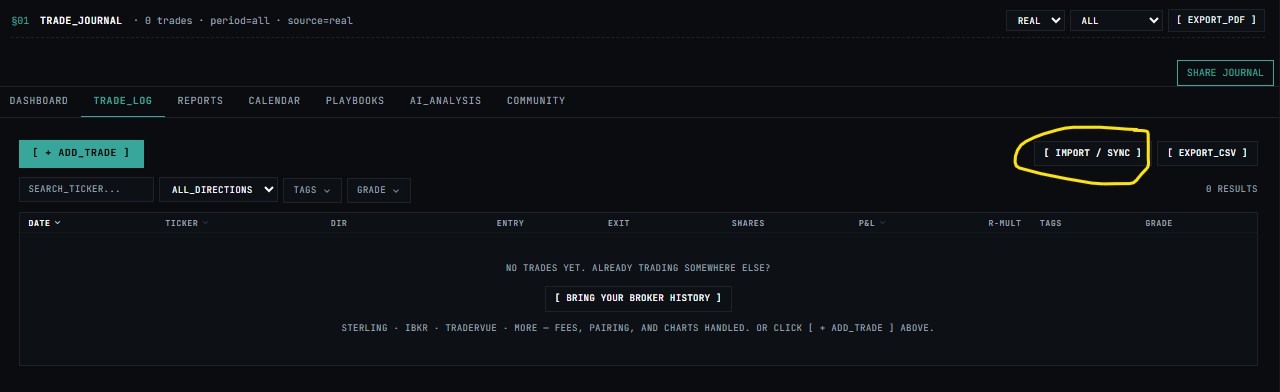
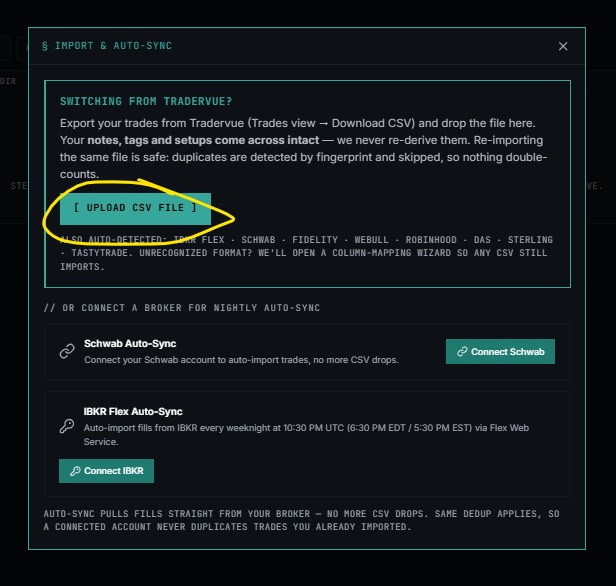
Click [ UPLOADE CVS file ]
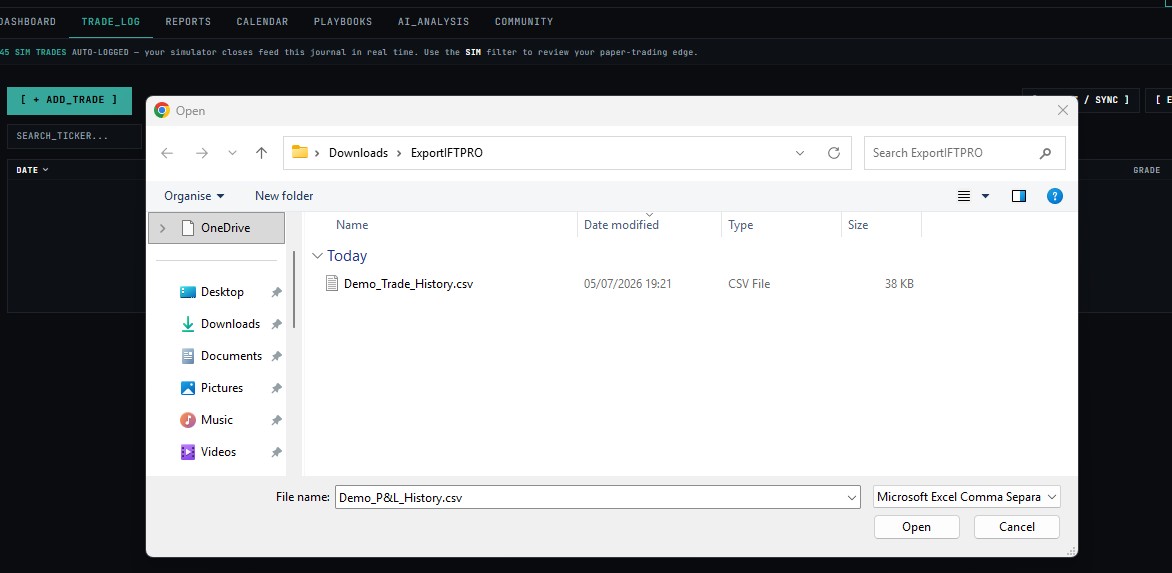
Import CVS file :Demo_Trade_History.csv
Once processed, trades will appear automatically The system tags these entries with STERLING-IMPORT to establish the data provenance trail.
Import completed
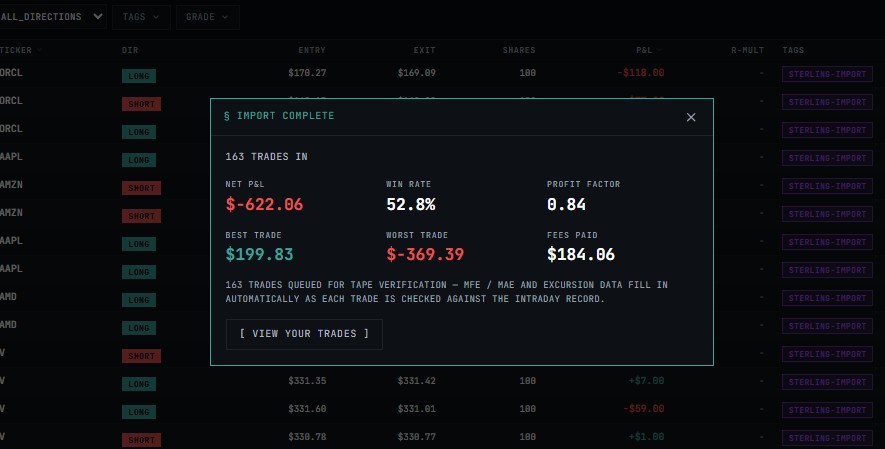
TRADES QUEUED FOR TAPE VERIFICATION — MFE / MAE AND EXCURSION DATA FILL IN AUTOMATICALLY AS EACH TRADE IS CHECKED AGAINST THE INTRADAY RECORD.
Dashboard¶

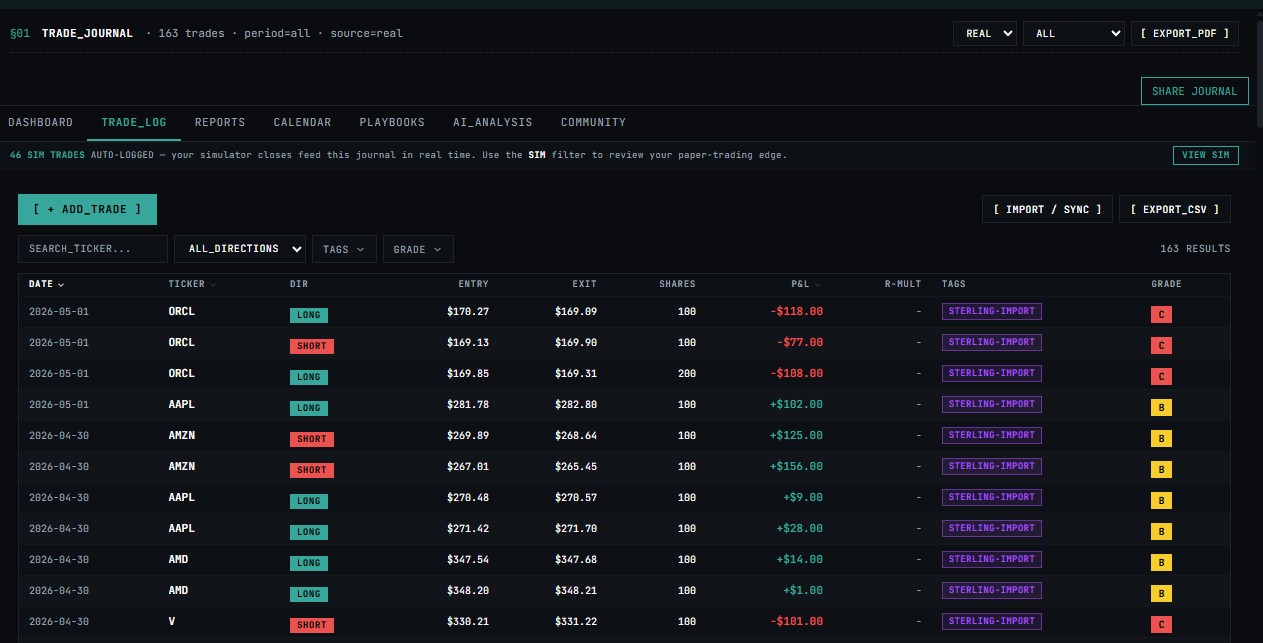
Trade_Log¶
Performance Auditing (Grading System)
- Grade B Trades: Represent controlled executions that successfully hit price targets or trailing stops within predefined risk boundaries.
- Grade C Trades: Typically represent disciplined errors, small slippage overruns, or manual exits that deviated slightly from strict playbook parameters. Review these records via the
AI_ANALYSIStab to discover systemic errors.
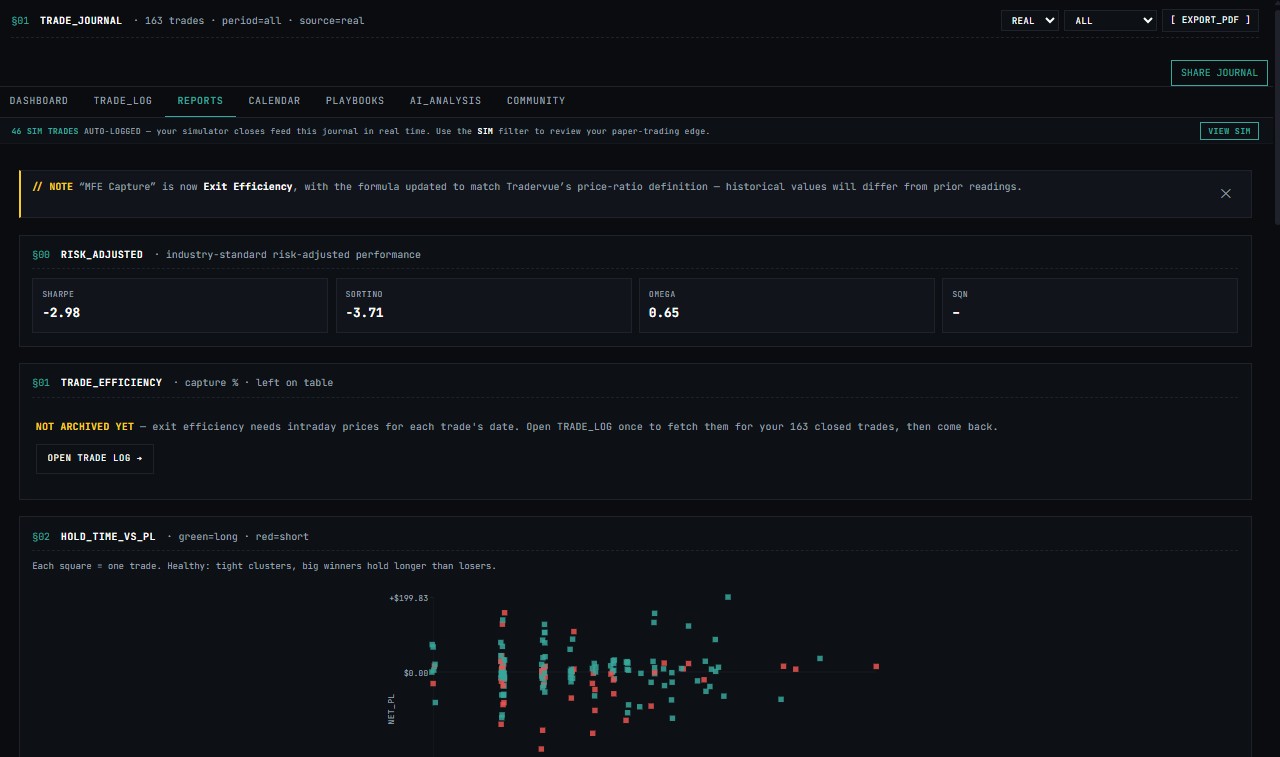
Reports¶
This interface processes trade execution logs to compute advanced mathematical performance ratios, capital efficiency scores, and statistical outliers regarding uncaptured potential profit.
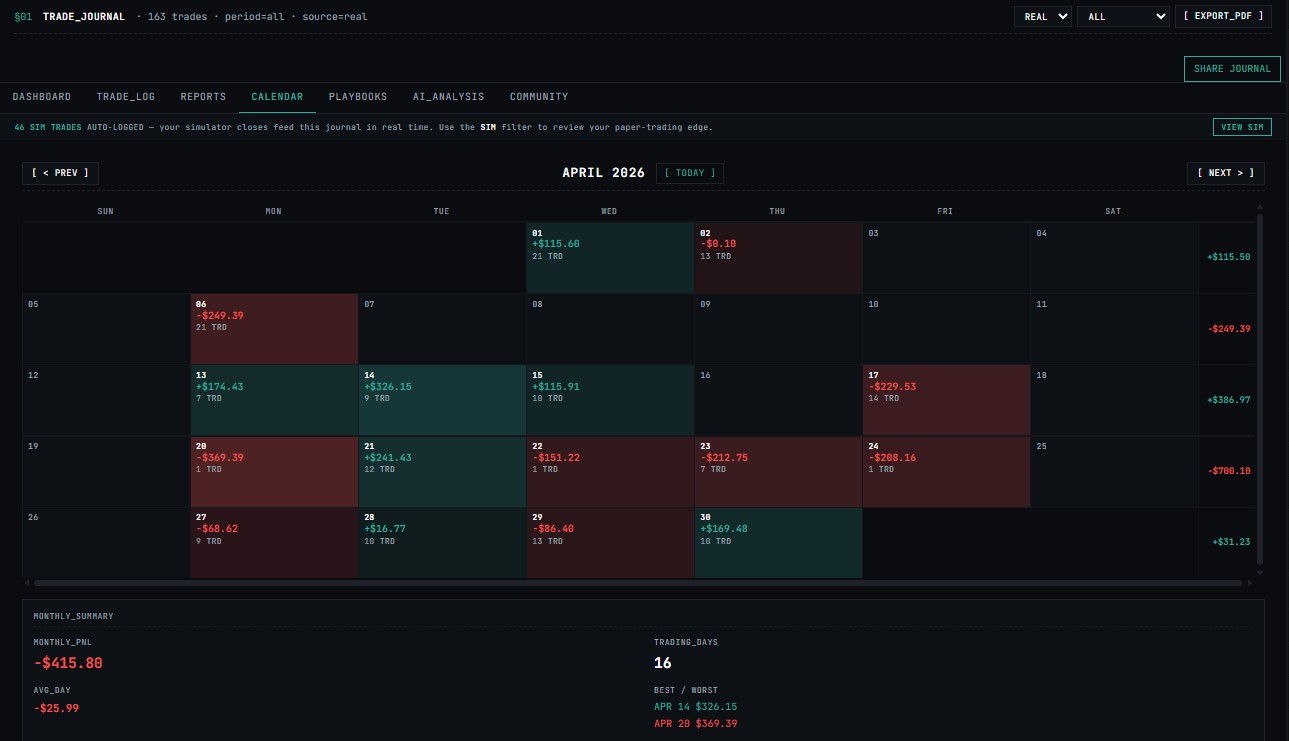
Calendar¶
PLAYBOOKS¶
Playbooks — your rule-defined setups + how they actually perform
NEW PLAYBOOK
No playbooks yet. A playbook is a setup with rules — entry trigger, stop rule, target, time window — so the journal can score how well each trade followed the plan and show which setups actually make money.
AI_ANALYSIS¶
Pattern Recognition
- Hold-time asymmetry: Winners average ~3.5 min hold vs losers ~3.8 min — essentially no asymmetry. However, the largest loser (UBER, −$234 net, 15 min) was held 3× longer than the median loser, and the 83-min WFC short (+$12.27 net) was a clear outlier, suggesting occasional patience on small winners but quick cutting of most losers.
- Win rate + average R-multiple: ~62% win rate (≈70 wins / 113 total). R-multiples not available in the data (all
rMultiple: null), so expectancy in R cannot be computed. Average net P&L per trade ≈ +$8.50, skewed by a few large wins (DELL +$525, +$567; AAPL +$200) and large losses (AMAT −$369, AMZN −$208, CRDO −$230). - Time-of-day / day-of-week P&L skew: All trades fall on weekdays spanning Apr 6 – Jul 10, 2026; no weekend data. Open-hour (09:30–10:00) trades produced the biggest absolute swings — DELL +$525/+567 (Jul 9, 09:35–09:36), AMZN −$208 (Apr 24, 09:32), AMAT −$369 (Apr 20, 09:31) — suggesting elevated risk appetite at the open. Late-afternoon (14:30–16:00) trades skew smaller and mixed. Midday (11:00–13:00) trades are notably calmer with fewer large losses.
- Symbol concentration / repeat-offender losers: AAPL (24 trades), AMZN (17), AMD (10), DELL (10), INTC (10) dominate volume. DELL is a repeat-offender loser on Jul 9 (two shorts at 09:31, −$121.47 net each, then a long at 10:30 for −$139.50 net). INTC on Jul 6 shows a long→short→long churn cluster (8 trades in ~30 min) netting roughly −$120. AMAT on Apr 17 (6 trades) and Apr 20 (1 trade) netted approximately −$640 combined — the single worst symbol-day.
- Revenge-trading (rapid re-entry after a loss): Multiple same-minute or next-minute re-entries after losses: DELL Jul 9 (short loss at 09:31, immediately re-shorted same tick, −$121.47 net again); DELL Jul 10 (long loss at 11:50 → re-long at 11:52 → re-long at 11:55, cumulative −$50 net); AAPL Jul 10 (short loss at 11:21 → re-short at 11:29, −$80.52 net); INTC Jul 6 (long loss at 15:49 → short at 15:50, then 3 more shorts in 3 min). Pattern is immediate direction-flip or doubling-down within 1–2 minutes of a loss.
- Short vs long asymmetry: Longs vastly outnumber shorts (~85 long vs ~28 short). Shorts show a lower win rate (~36% vs ~67% for longs) and larger average loss (short avg net P&L ≈ −$35 vs long avg ≈ +$20). Worst shorts: AMAT −$369 (Apr 20), AMZN −$208 (Apr 24), AMD −$151 (Apr 22), DELL −$243 combined (Jul 9). The trader is clearly more skilled long than short but shorts aggressively with size.
Weekly Summary
Week Performance Recap
Summary - Net P&L: +$1,035.93 - Win Rate: 62.5% (45 wins / 27 losses out of 72 closed trades) - Total commissions paid: ~$95.07
Best Trade - DELL long on 2026-07-08: +$567.04 net (entry $426.00 → exit $431.68, 100 shares, 1-minute hold)
Worst Trade - UBER long on 2026-07-10: -$234.03 net (entry $75.80 avg → exit $75.34, 500 shares, 15-minute hold)
Dominant Pattern Overtrading a single ticker with rapid-fire scalps. You traded AAPL 22 times and INTC 12 times, with most holds under 3 minutes. While many of these were small wins, the pattern of immediately re-entering the same ticker led to compounding losses on bad entries (e.g., 3 consecutive DELL longs on 7/10 all lost). You also showed a tendency to fight the trend — multiple longs into a declining tape (UBER, GOOG, INTC) and shorts into a rising one (AAPL, DELL).
Focus for Next Week Cap entries at 2 per ticker per session. The data shows diminishing edge after the first 1-2 trades on a name — by the 3rd+ entry on AAPL, DELL, and INTC, losses clustered. Let the first trade's result inform whether a second is warranted, then step away from that ticker.
Monthly Summary
COMMUNITY¶
Trade Log Table Schema¶
The core data table contains 10 columns providing a complete financial and qualitative overview of each completed trade.
| Column Name | Data Type | Description / Formatting Rules |
|---|---|---|
| DATE | Date (YYYY-MM-DD) | The execution date of the trade closing leg or primary session date. |
| TICKER | String (Uppercase) | The standard exchange market identifier symbol (e.g., ORCL, AAPL, AMZN, AMD, V, AMAT). |
| DIR | Enum [LONG, SHORT] | LONG: Color-coded in teal/green background. SHORT: Color-coded in coral/red background. |
| ENTRY | Currency (USD) | The average execution price at position entry/opening. |
| EXIT | Currency (USD) | The average execution price at position liquidation/closure. |
| SHARES | Integer | The absolute quantity of shares or contracts traded. |
| P&L | Currency (USD) | Net profit or loss for the trade. Color-coded natively: • Positive numbers: Mint Green with a leading plus sign (e.g., +$102.00).• Negative numbers: Coral Red with a leading minus sign (e.g., -$118.00). |
| R-MULT | Float / Numeric | Risk Multiplier metric ($R$-Multiple). Represents profit/loss relative to initial risk units defined in the playbook. |
| TAGS | String List | Meta-tags attached to the trade. In image_2a067b.png, trades auto-ingested via Sterling are badged with a purple STERLING-IMPORT tag. |
| GRADE | Character [A, B, C, D, F] | Performance/Execution discipline grade assigned to the trade. Color-coded based on quality (e.g., B is Gold/Yellow, C is Coral/Orange). |