§01 TRADE_JOURNAL - CALENDAR¶
· CALENDAR tab · monthly P&L view with daily trade activity
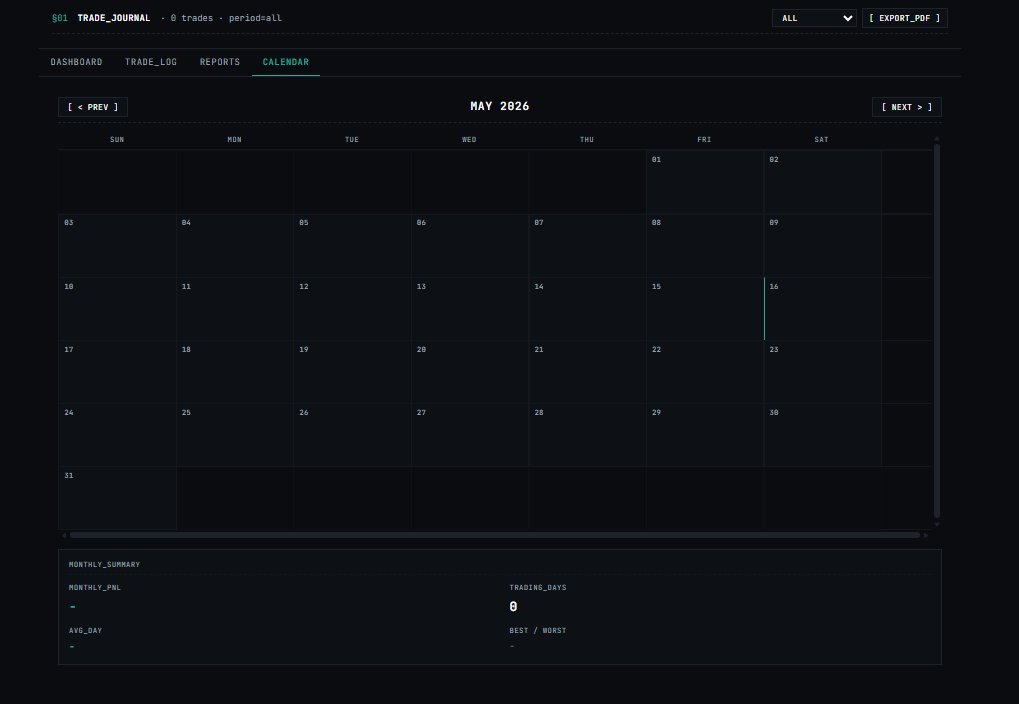
What It Shows¶
A month-by-month calendar where each day cell shows the P&L and trade activity for that date. Navigate between months with [ < PREV ] and [ NEXT > ]. Today's date is highlighted with a teal marker (e.g. 16 in May 2026).
Calendar Navigation¶
| Control | Action |
|---|---|
[ < PREV ] |
Navigate to previous month |
[ NEXT > ] |
Navigate to next month |
| Month/Year header | Current displayed month (e.g. MAY 2026) |
Day Cells¶
Each calendar cell represents one trading day:
| Cell State | Display |
|---|---|
| No trades | Empty cell |
| Profitable day | Green P&L figure |
| Loss day | Red P&L figure |
| Today | Teal left-border highlight |
| Weekend / market closed | Dimmed cell (SAT / SUN columns) |
MONTHLY_SUMMARY Panel¶
A summary bar below the calendar grid aggregates the entire displayed month:
| Metric | Description |
|---|---|
MONTHLY_PNL |
Total P&L for the month (− when no trades) |
TRADING_DAYS |
Number of days with at least one trade logged |
AVG_DAY |
Average daily P&L across trading days (− when no trades) |
BEST / WORST |
Best and worst single trading day of the month (− when no trades) |
Period Filter Interaction¶
The ALL dropdown in the header filters which trades are included in the calendar. Filtering by a specific ticker or tag updates the calendar cells to show only matching trade P&L for each day.
Weekly review workflow
Open the Calendar tab every Sunday. Scan for: (1) any days with outsized losses — what setup caused it? (2) best days — what conditions were present? (3) missing days — were they skipped due to discipline or missed opportunity? The visual pattern of red vs green days reveals consistency faster than a P&L table.