§01 TRADE_JOURNAL - DASHBOARD¶
· DASHBOARD tab · performance overview

What It Shows¶
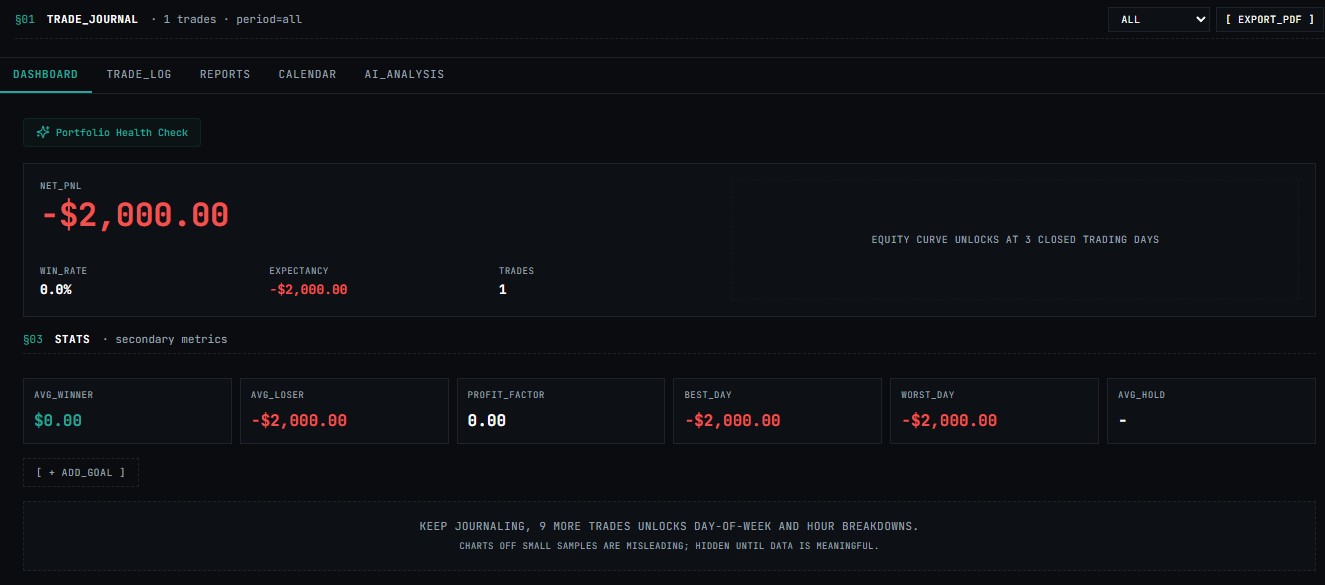
The Dashboard tab is the landing view of the Trade Journal — a high-level summary of your trading performance across the selected period. Displays P&L curves, win/loss metrics, and key statistics derived from all logged trades in TRADE_LOG.
Header Bar¶
| Element | Description |
|---|---|
§01 TRADE_JOURNAL |
Module label |
· 0 trades · |
Live count of trades in the selected period |
period=all |
Active period filter |
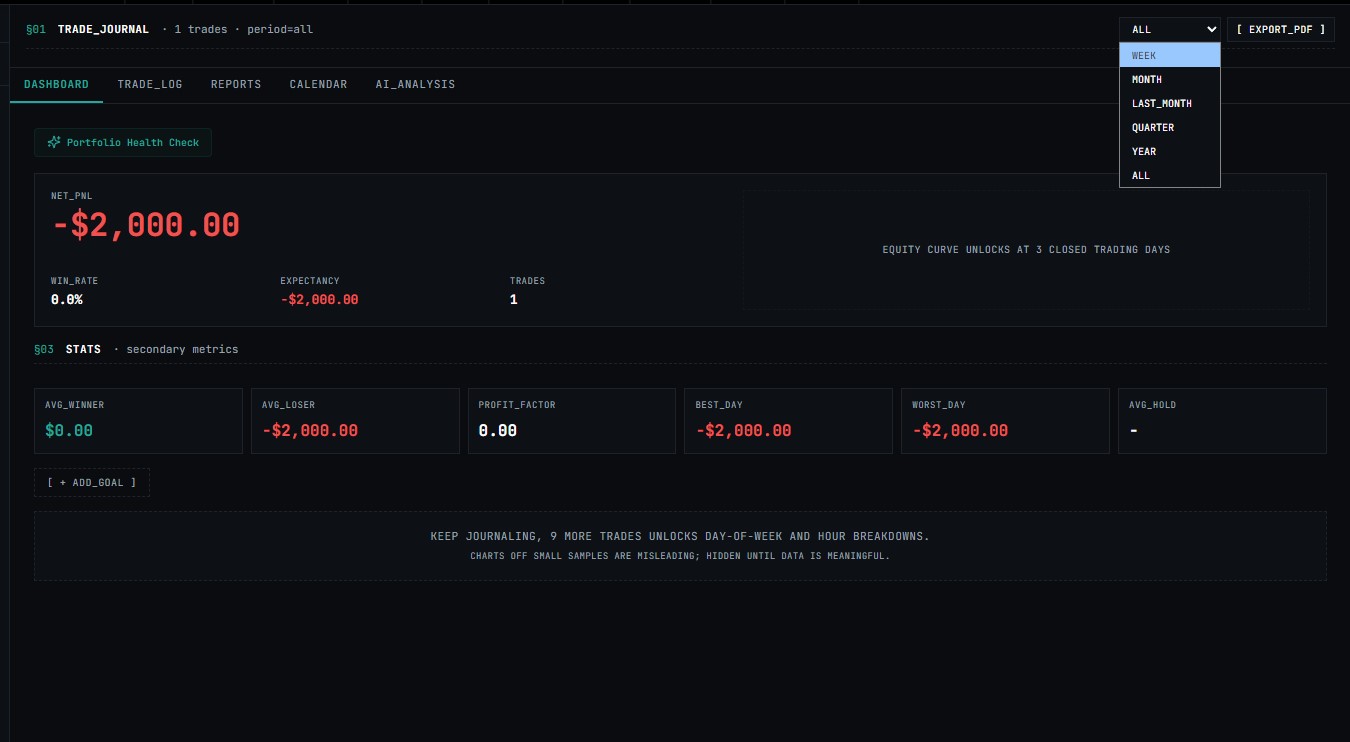
ALL dropdown |
Filter by ticker, strategy, or tag group |
[ EXPORT_PDF ] |
Export current dashboard view as PDF |
Dashboard Panels¶
(populated once trades are logged)
- Equity Curve — cumulative P&L over time
- Win Rate — % of trades closed profitably
- Avg R — average return relative to initial risk
- Profit Factor — gross profit ÷ gross loss
- Best Trade — highest single-trade gain
- Worst Trade — largest single-trade loss
- Total Trades — count across selected period
- Avg Hold Time — mean duration per trade