§02 CHARTS - TIMEFRAMES¶
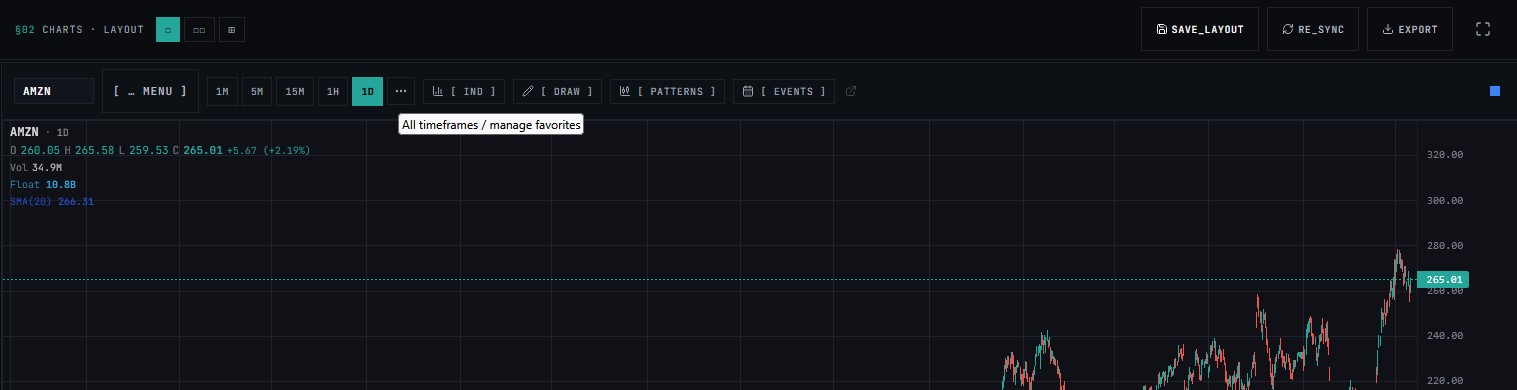
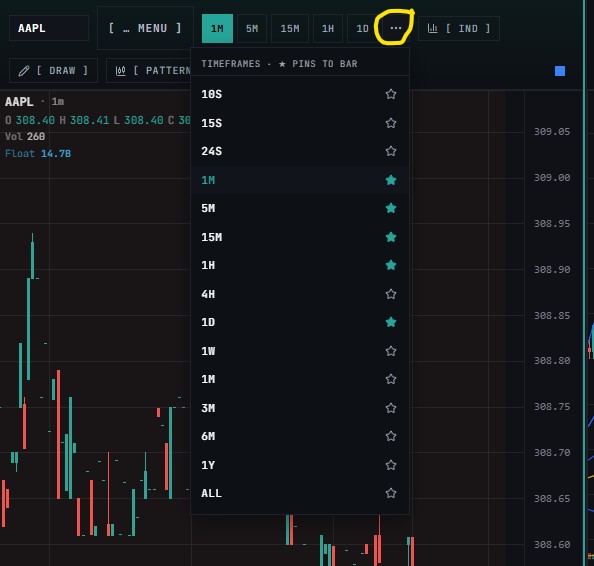
15 timeframes — from 10-second scalp tape to all-time monthly. Select from the toolbar row above the chart or use number-key shortcuts.
Access: CHARTS → ... [ Timeframe ] button in the toolbar.
Every chart panel has an independent timeframe. Switch using the toolbar row, number keys 1–9, or by typing a timeframe into the command palette (⌘K). VWAP renders automatically on intraday intervals and hides on 1D and above. Pre-market and after-hours data is toggled in Settings → Chart Defaults.
Full Timeframe Reference¶
| Timeframe | Label | Key | Category | Best For |
|---|---|---|---|---|
| 10 seconds | 10s |
— | Scalp | Tape reading, order flow, momentum bursts |
| 15 seconds | 15s |
— | Scalp | Opening range execution, fast momentum |
| 24 seconds | 24s |
— | Scalp | Algorithmic and HFT reference intervals |
| 1 minute | 1m |
1 |
Intraday | Day trading, ORB setups, intraday trend |
| 2 minute | 1m |
1 |
Intraday | Day trading, ORB setups, intraday trend |
| 5 minutes | 5m |
2 |
Intraday | Continuation setups, VWAP reclaims |
| 15 minutes | 15m |
3 |
Intraday | Intraday structure, mid-session pivots |
| 30 minutes | 30m |
4 |
Intraday | Intraday macro view, half-day trend |
| 1 hour | 1H |
5 |
Swing | Swing entry context, key S/R levels |
| 4 hours | 4H |
6 |
Swing | Multi-day trend, position sizing context |
| Daily | 1D |
7 |
Swing / Position | Higher-timeframe trend, swing setups |
| Weekly | 1W |
8 |
Position | Long-term trend, major structure levels |
| Monthly | 1M |
9 |
Position | Macro view, multi-year trend |
| 3 Months | 3M |
— | Position | Quarterly performance and structure |
| 6 Months | 6M |
— | Position | Semi-annual trend context |
| 1 Year | 1Y |
— | Position | Annual range and key pivots |
| All Time | ALL |
— | Reference | Full price history from first available bar |
 ¶
¶
Keyboard Shortcuts¶
Number keys 1–9 map to the most-used intraday and swing timeframes. Keys only fire when a ticker is loaded and focus is outside a text input.
10s · 15s · 24s · 3M · 6M · 1Y · ALL are accessible from the toolbar row only.
Intraday History Depth¶
| Timeframe | Available History |
|---|---|
| 10s · 15s · 24s | Current session only |
| 1m | ~10 trading days |
| 5m | ~60 trading days |
| 15m · 30m | ~6 months |
| 1H · 4H | ~2 years |
| 1D and above | Full available history |
VWAP Behaviour¶
VWAP renders automatically on all intraday intervals (10s → 4H). It is hidden on 1D and above — this is by design, not a bug.
VWAP (Volume Weighted Average Price) is a trading indicator that calculates the average price a security has traded at, weighted by volume. It's useful for assessing whether a price is high or low relative to its average, and is commonly used by institutional traders to determine optimal entry/exit points.
Extended Hours¶
Pre-market (4:00–9:30 AM ET) and after-hours (4:00–8:00 PM ET) data is off by default. Enable in Settings → Chart Defaults. Extended hours bars appear as dimmed candles outside regular session boundaries.
Timeframe pairings for active traders
-
Scalp:
1mprimary ·5mcontext ·1Dtrend -
Day trade:
5mprimary ·15mstructure ·1Dbias -
Swing:
1Hentry ·4Hcontext ·1Wtrend -
Position:
1Dentry ·1Wstructure ·1Mmacro