§02 CHARTS - DRAW¶
Drawing tools available in the CHARTS module — overlay trendlines, levels, and measurements directly on any chart.
Access:
CHARTS→[ DRAW ]button in the toolbar.
§04 DRAW¶
| Note | Description |
|---|---|
| [ DRAWING TOOLS REQUIRE DESKTOP ] | Trendlines, fib retracements, and rectangles need a precision pointer |
Drawing tools are not available on touch/mobile. Switch to the desktop app or browser to access trendlines, Fibonacci retracements, and rectangle overlays.
LINES¶
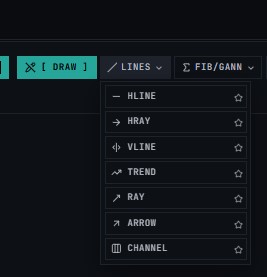
HLINE¶
Horizontal Line tool — draws a fixed horizontal level across the full width of the chart.
How to use:
- Click
[ DRAW ]→ select HLINE - Click any price level on the chart to place a horizontal line at that price
Common uses:
| Use | Example |
|---|---|
| Prior highs / lows | Mark a 52-week high as resistance |
| Round numbers | $100, $200, $500 psychological levels |
| VWAP anchors | Mark yesterday's VWAP close |
| Gap levels | Mark the top and bottom of an unfilled gap |
| Earnings reaction | Mark the post-earnings gap level |
Tip: Horizontal lines at prior highs and lows are the most objective support/resistance levels on a chart — they mark where price has previously reversed, where large orders were placed, and where institutional memory lives.
Delete a HLINE
-
Deleting a single drawing. You can remove just one line without clearing everything:
-
Click directly on the line to select it (it'll highlight), then press Delete or Backspace. Only that one goes away.
- Or right-click the line and choose "Delete drawing."
- And if you remove the wrong one, Cmd/Ctrl+Z brings it right back.

HRAY¶
VLINE¶
Vertical Line tool — draws a fixed vertical line across the full height of the chart at a specific date/time.
How to use:
- Click
[ DRAW ]→ select VLINE - Click any point on the chart to place a vertical line at that timestamp
Common uses:
| Use | Example |
|---|---|
| Earnings dates | Mark the bar where the company reported |
| FOMC decisions | Mark Fed announcement days |
| News events | Mark a major catalyst (merger, FDA decision) |
| Session opens | Mark 9:30 AM ET on intraday charts |
| Volume events | Mark a day with unusually high volume |
Tip: Combine a VLINE with an HLINE at the same location to mark both the when and what price of a key event — useful for anchoring Anchored VWAP analysis.
TREND¶
Trendline tool — draws a straight diagonal line between two anchor points, extending in both directions.
How to use:
- Click
[ DRAW ]→ select TREND - Click your first anchor point on the chart
- Click your second anchor point to complete the line
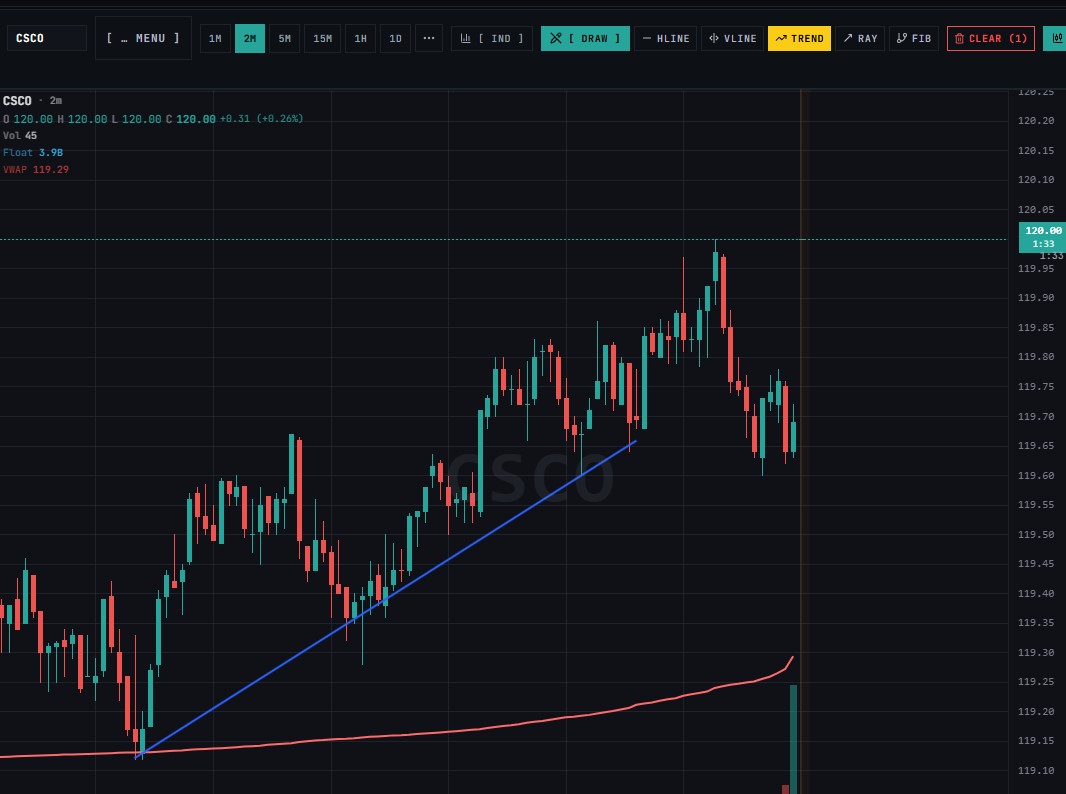
Uses:
- Connect two or more swing lows to draw an uptrend support line
- Connect two or more swing highs to draw a downtrend resistance line
- Extend forward to project where the line will intersect future price action
Tip: A trendline becomes more significant each time price touches it and bounces — two touches define it, three or more confirm it. A close through the trendline on elevated volume is the most reliable break signal.
RAY¶
Ray tool — draws a one-directional line from a single anchor point, extending infinitely forward in time.
How to use:
- Click
[ DRAW ]→ select RAY - Click your anchor point (the origin of the ray)
- Click a second point to set the angle and direction
Unlike the TREND line (which extends in both directions), a RAY only projects forward from its origin — useful for projecting a slope from a specific date without cluttering historical price action.
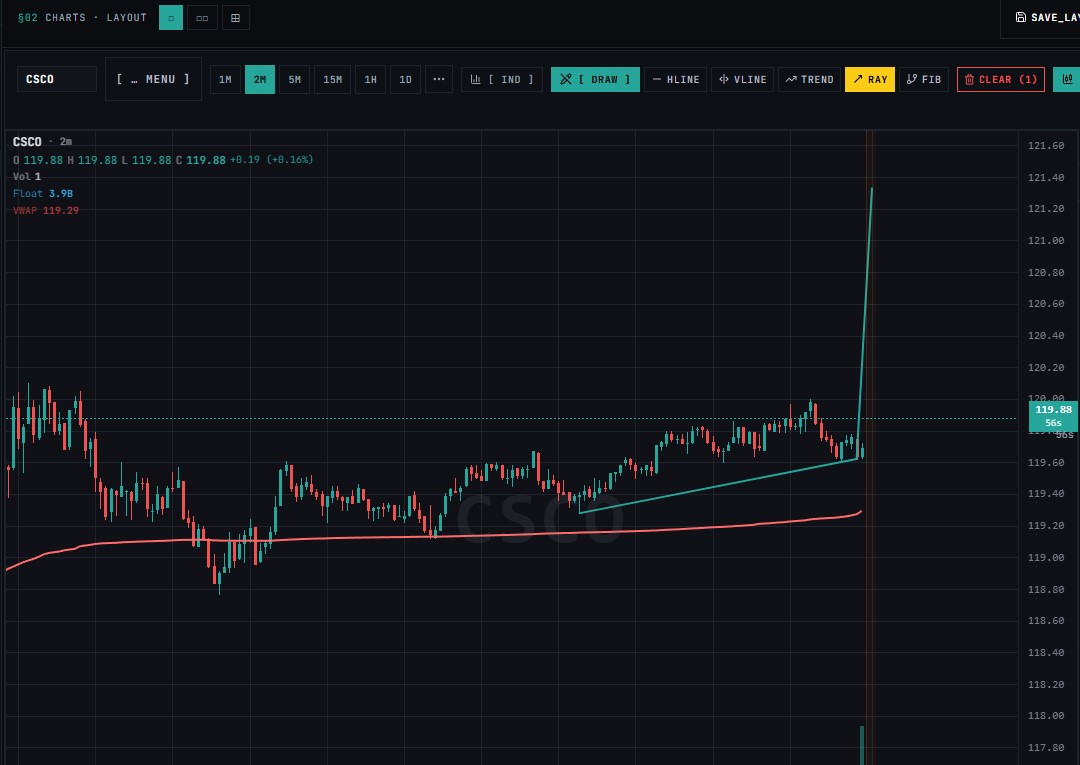
Common uses:
- Project a trendline forward from its most recent touch point
- Draw a price projection line from a breakout point
- Estimate where a diagonal moving average will be in future sessions
Tip: Rays are useful for projecting the slope of a channel into the future. Draw one ray along the highs and one along the lows of a price channel to see where price is likely to be in the coming days or weeks.
ARROW¶
ARROW / market, drag from tail to head
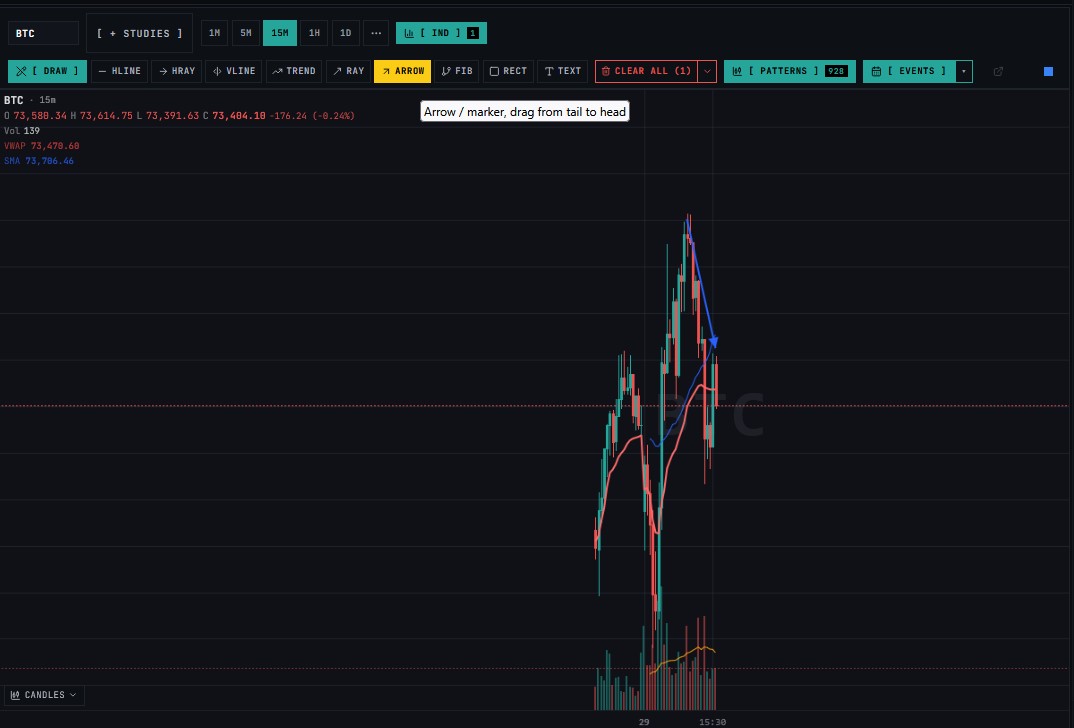
CHANNEL¶
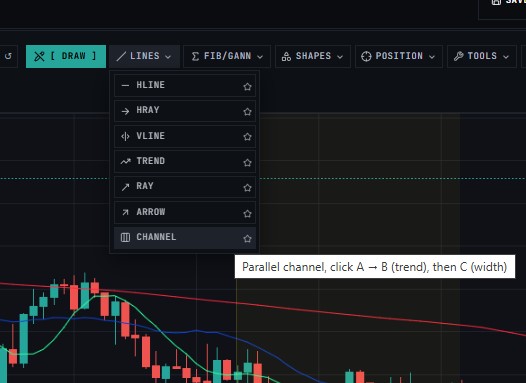
ZIGZAG¶

ATR CH¶

FIB/GANN¶
Fibonacci Retracement tool — draws horizontal levels at the key Fibonacci ratios between any two price points.
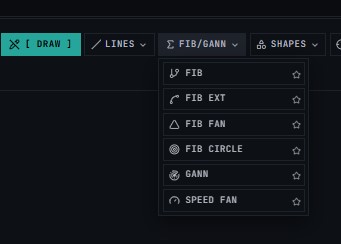
FIB¶
How to use:
- Click
[ DRAW ]→ select FIB - Click and drag from a swing low to a swing high (or high to low for a downtrend)
- Levels are automatically plotted at the standard ratios
Levels drawn:
| Level | Ratio |
|---|---|
| 0% | Start point (your first click) |
| 23.6% | First shallow retracement zone |
| 38.2% | Common first support in strong trends |
| 50.0% | Midpoint — not a Fibonacci number but widely used |
| 61.8% | The "golden ratio" — strongest retracement level |
| 78.6% | Deep retracement — last support before full reversal |
| 100% | End point (your second click) |
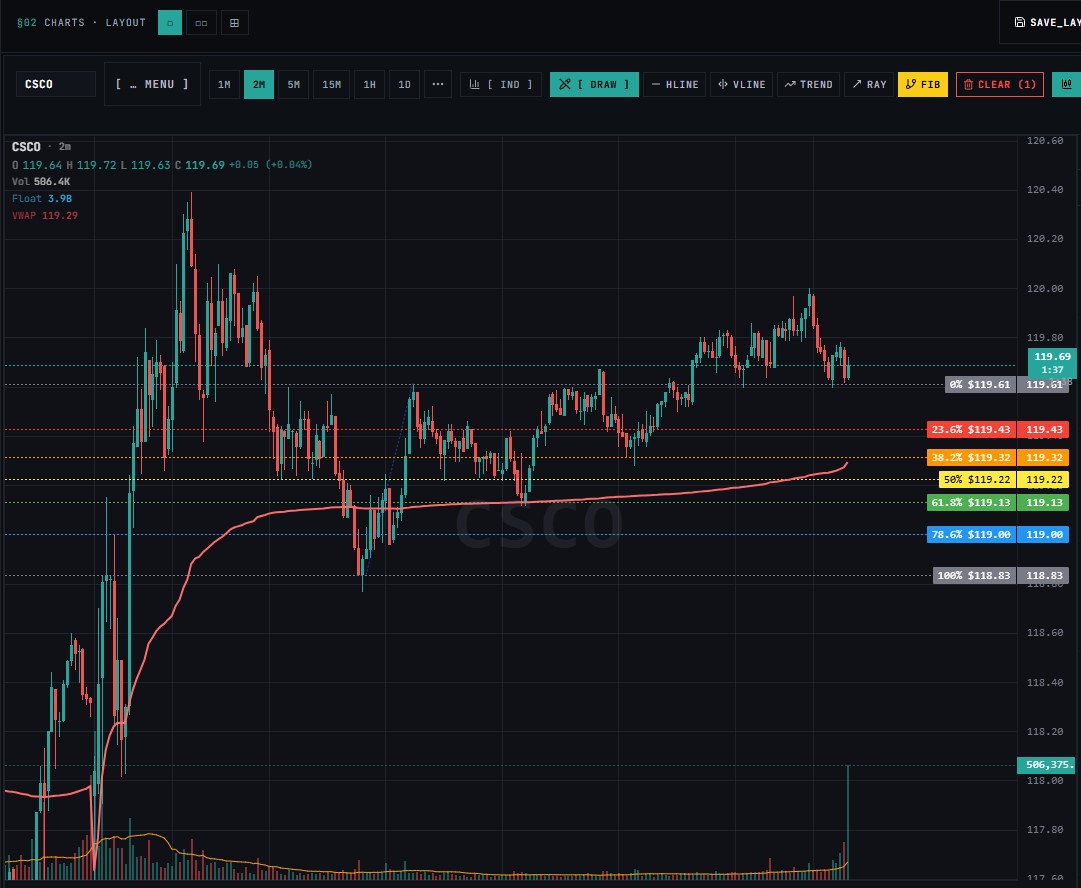
Tip: Draw from the most recent significant swing low to the swing high for pullback support levels in an uptrend. The 38.2% and 61.8% levels are the most watched by institutional traders.
FIB EXT¶
FIB FAN¶
FIB CIRCLE¶
GANN¶
SPEED FAN¶
SHAPES¶
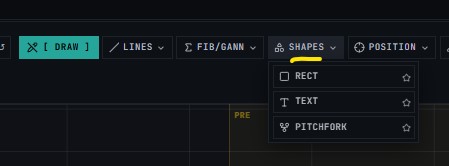
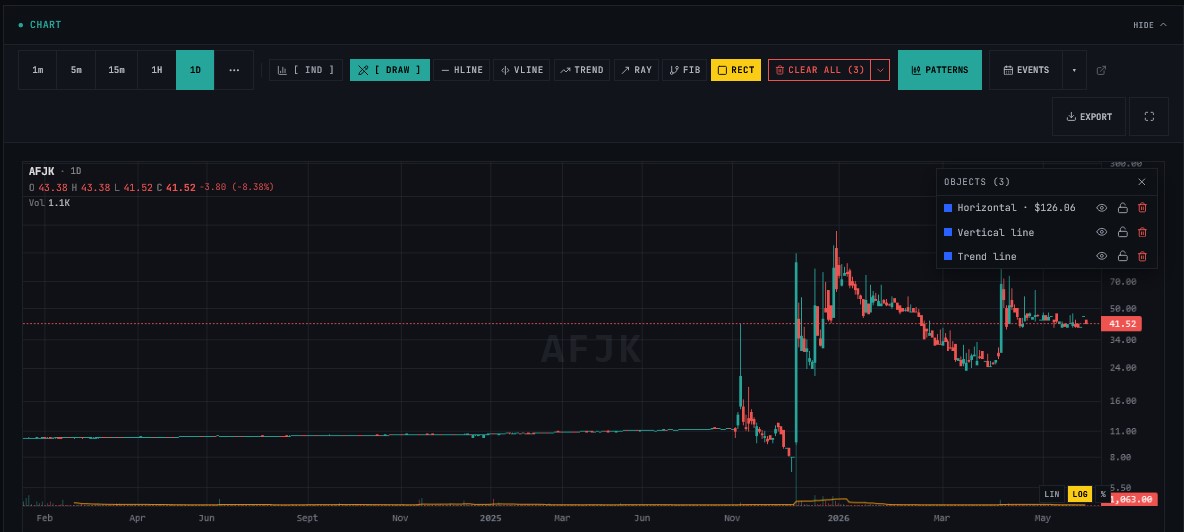
RECT¶
Rectangle /zone , click tow corners
TEXT¶

Text / callout label, click to place
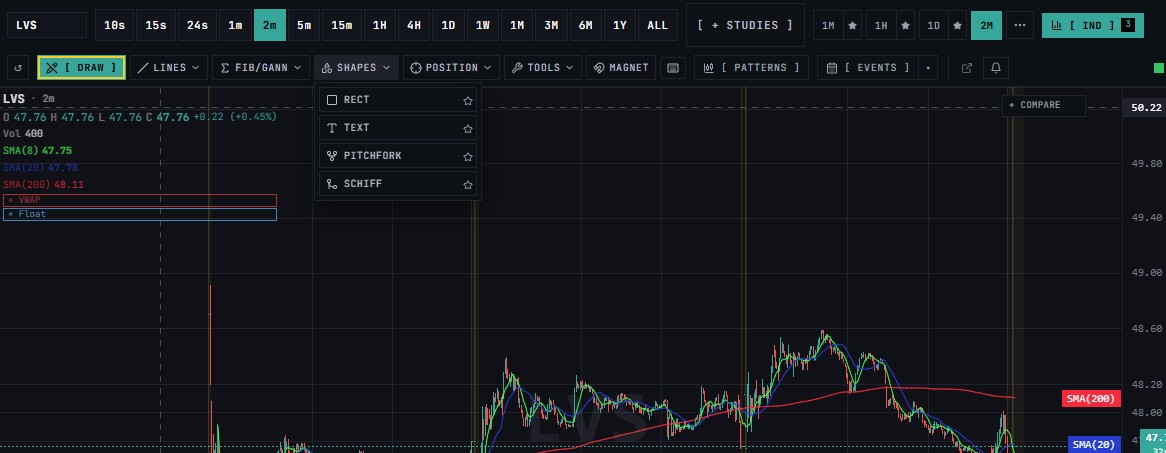
PITCHFORK¶
SCHIFF¶

POSITION¶
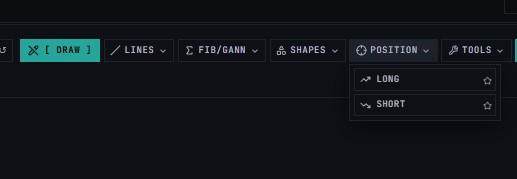
Long Position and Short Position drawing tools help estimate how a hypothetical trade may perform before placing a real order. They can show projected profit and loss, risk, position size, target and stop levels, and estimated account balance after a take-profit or stop-loss event.
These tools are useful for practicing order planning and risk management without committing actual capital.
Basic workflow¶
- Choose either the Long Position or Short Position drawing tool.
- Open the tool’s settings/properties.
- Enter or adjust values such as:
- Initial account size
- Risk amount, either as a fixed value or a percentage of the account
- Lot size
- Leverage
- Entry price
- Profit target
- Stop level
- Quantity precision
- Confirm the settings.
- Review the labels shown by the drawing tool, including:
- Position size
- Estimated balance if take profit is reached
- Estimated balance if stop loss is reached
- Target and stop levels
- Profit and loss
- Quantity
- Risk/reward ratio
- Open or closed PnL
LONG¶
SHORT¶
When risk is entered as a percentage of the account size.
Compact stats mode The tool includes a Compact stats mode option. Enabling it reduces how much space the position-performance labels take up on the chart.
Managing Drawings¶
| Action | How |
|---|---|
| Select a drawing | Click on the line to select it |
| Move a drawing | Drag the selected line to a new position |
| Delete a drawing | Select it → press Delete or Backspace |
| Lock a drawing | Right-click → Lock (prevents accidental moves) |
| Change colour | Right-click → Style settings |
| Save drawings | Drawings are saved with the chart layout automatically |
TOOLS¶
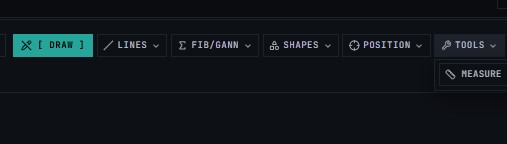
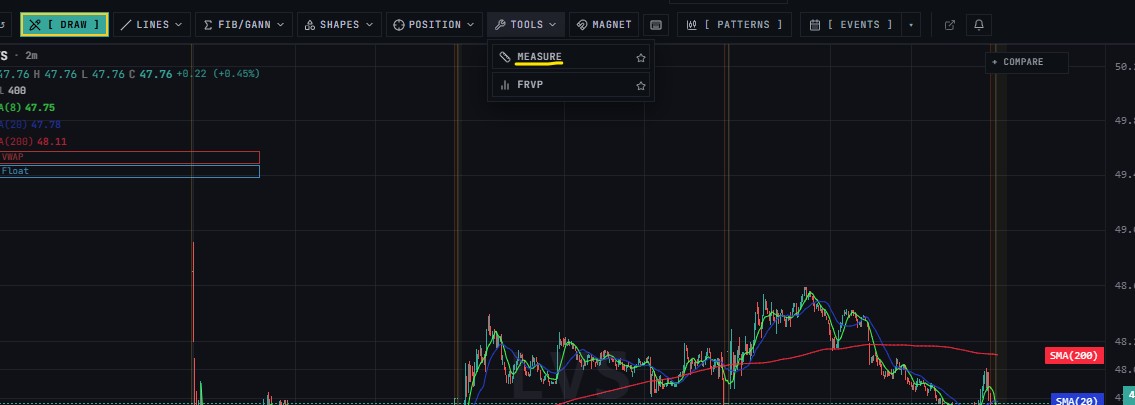
MEASURE¶
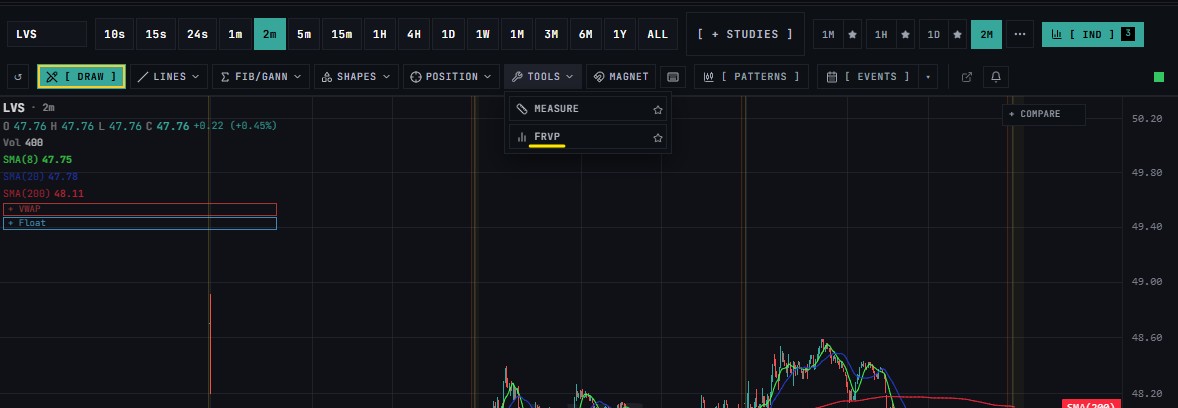
FRVP¶
MAGNET¶
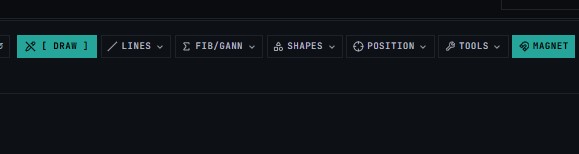
Magnet Mode is a charting tool that automatically snaps your drawing anchors (like the ends of trend lines, support/resistance levels, or Fibonacci tools) precisely to meaningful chart data, such as candlestick wicks or indicator plots.It eliminates manual guesswork, allowing you to quickly draw perfectly precise lines, support zones, and measured moves
Magnet Mode tool automatically snaps your drawing anchors (like trendlines, horizontal lines, or Fibonacci levels) to the exact Open, High, Low, or Close (OHLC) prices of the nearest candlestick, or to plotted indicators.
This feature ensures highly accurate technical analysis and prevents minor manual placement errors
Show indicator on axis¶
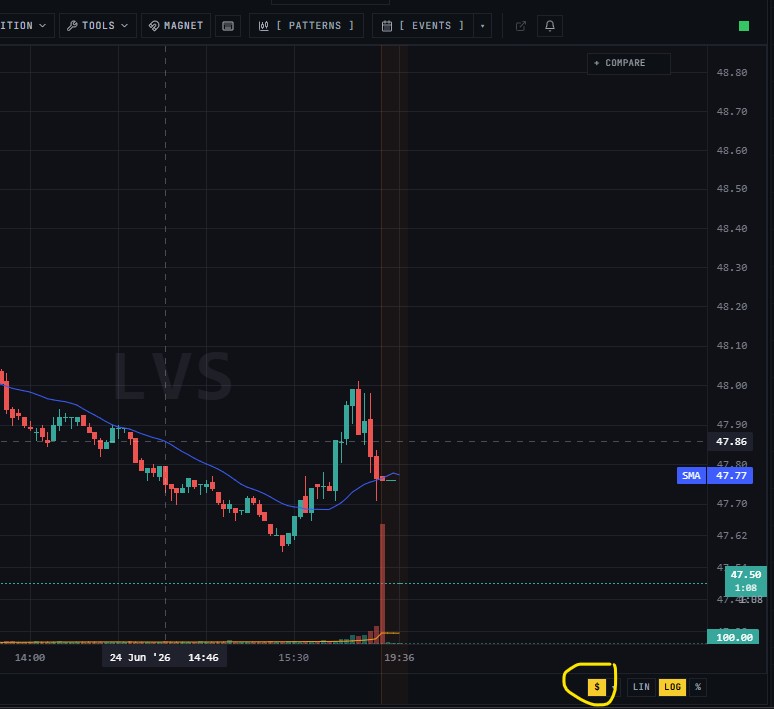
LIN/LOG/Percent¶
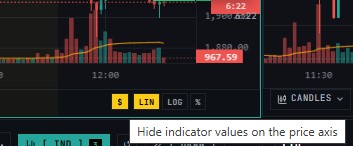
- LINear scale
- LOGarithmic scale
- Percent scale