§02 CHARTS - COMPARE¶
Compare draws each ticker as a percent change from the same starting point. Two stocks with very different prices, or a stock and its sector ETF, can then be judged fairly on one chart. It is free with a Tapeboard account.
Compare — NVDA, AAPL, AMD, SPY all normalized to % return since the window starts
HOW TO COMPARE TICKERS¶
Click Compare in the sidebar.
Type a ticker in the ADD_SYMBOL... box and pick it from the list. It is added as a colored line.
Add more the same way, up to ten. Each gets its own color and appears as a chip above the box.
Click the × on a chip to remove a ticker.
The legend at the right lists the latest percent value for each ticker. Every line starts at 0%.
HOW TO PICK THE TIME RANGE¶
In the RES row, choose the bar size: 1D for daily bars, or 1m, 5m, 15m or 30m for intraday.
With daily bars, pick a range: 1M, 3M, 6M, 1Y or 5Y.
With intraday bars, pick 1D or 5D.
The chart redraws from zero for the new window.
With more than five tickers on 1m bars, Compare switches to 5m to keep the chart fast. A note beside the buttons says when it has done that.
HOW TO COMPARE ON A CHART INSTEAD¶
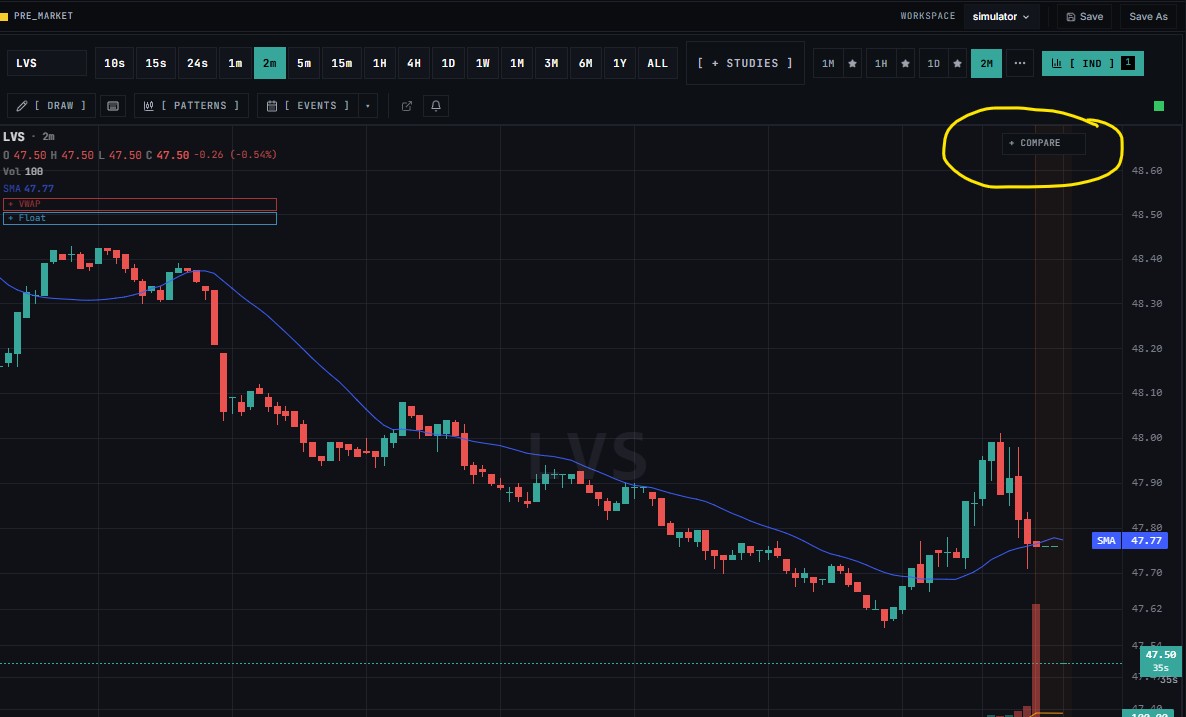
Use the COMPARE button on any chart when you want candles, drawings and indicators for the main symbol with a second symbol laid over it. It adds up to four symbols.
GOOD TO KNOW¶
The line that ends highest is the best performer over your window. A line that starts fast and fades tells you the move is over.
The chart uses price changes only.
To study how closely tickers move together rather than how far, use Correlation.
IF SOMETHING DOESN'T WORK¶
- A ticker will not add
- check the spelling and pick it from the list. The limit is ten.
- A line is missing or short
- the ticker has little data in that window, such as a recent listing.
- The chart is empty
- add at least one ticker.
- The window I want is missing
- intraday bars only offer
1Dand5D.