§02 CHARTS - CANDLES¶
The chart panel supports six display modes selectable from the chart-type dropdown in the top-left toolbar. The active mode applies instantly with no page reload.
Chart Types¶
| Mode | Description |
|---|---|
| Candles | Standard OHLC candlestick bars. Green (teal) body = close above open; red body = close below open. Default view. |
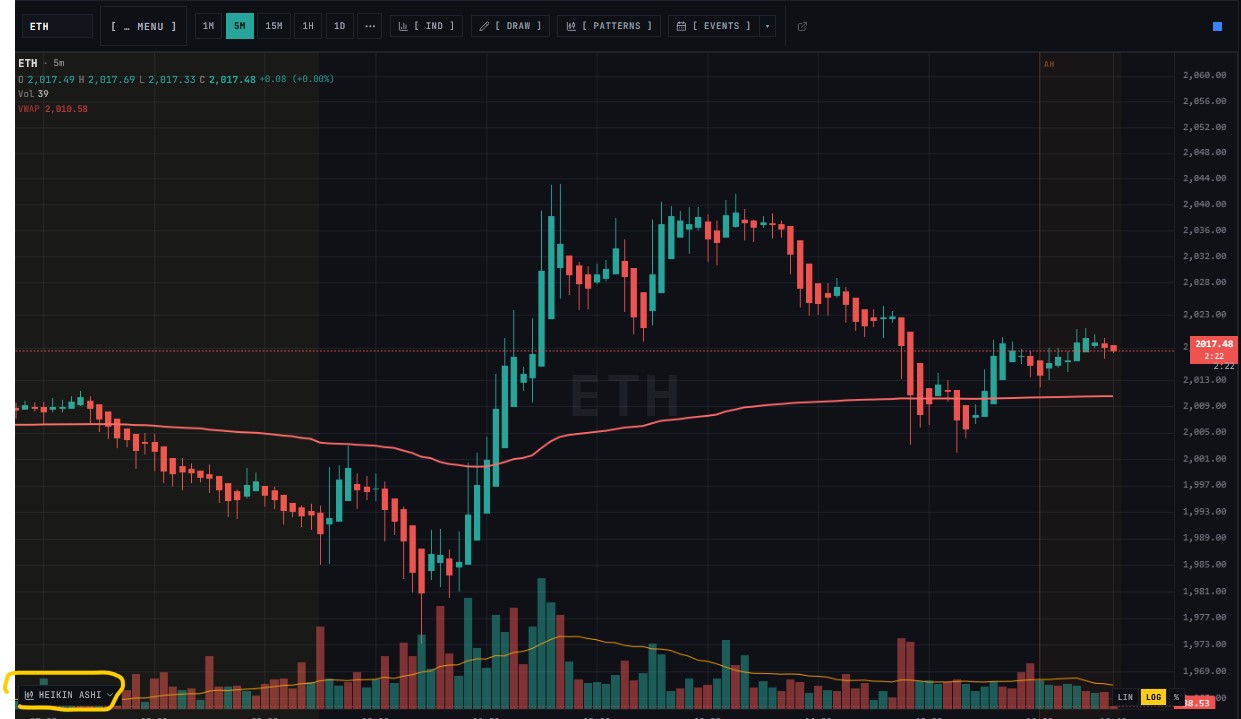
| Heikin Ashi | Smoothed candles calculated from averaged OHLC values. Reduces noise and makes trends easier to read; does not reflect true open/close prices. |
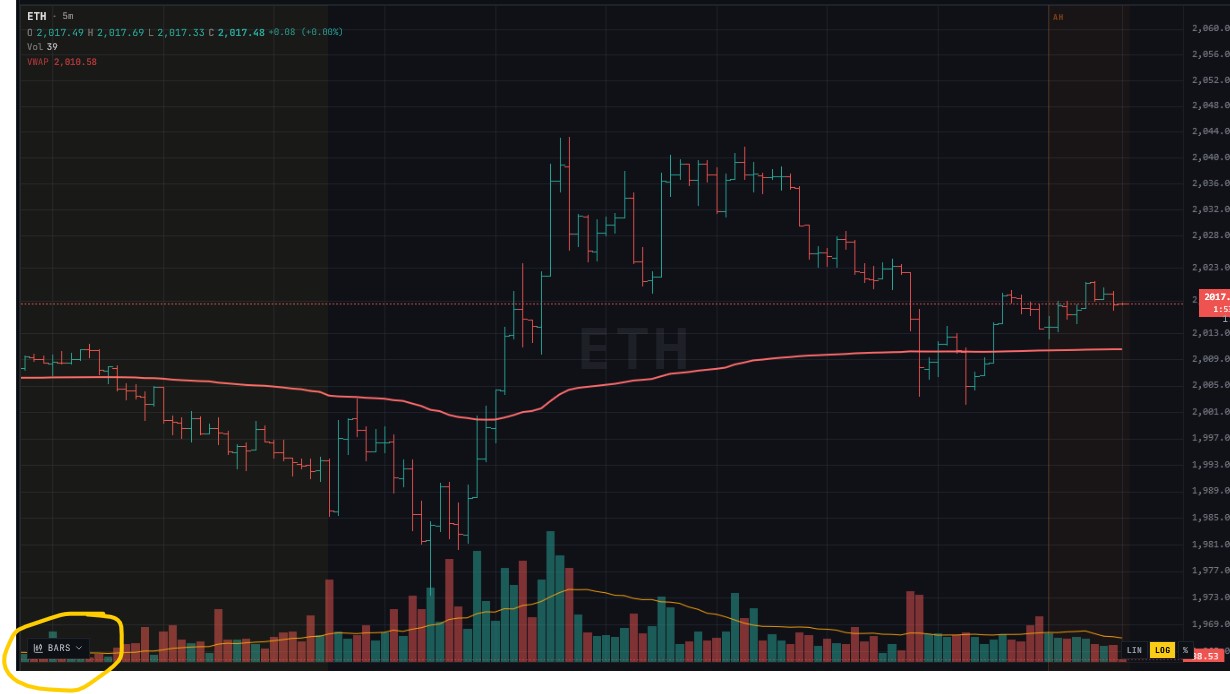
| Bars | OHLC represented as a vertical line with left tick (open) and right tick (close). Same data as candles, more compact. |
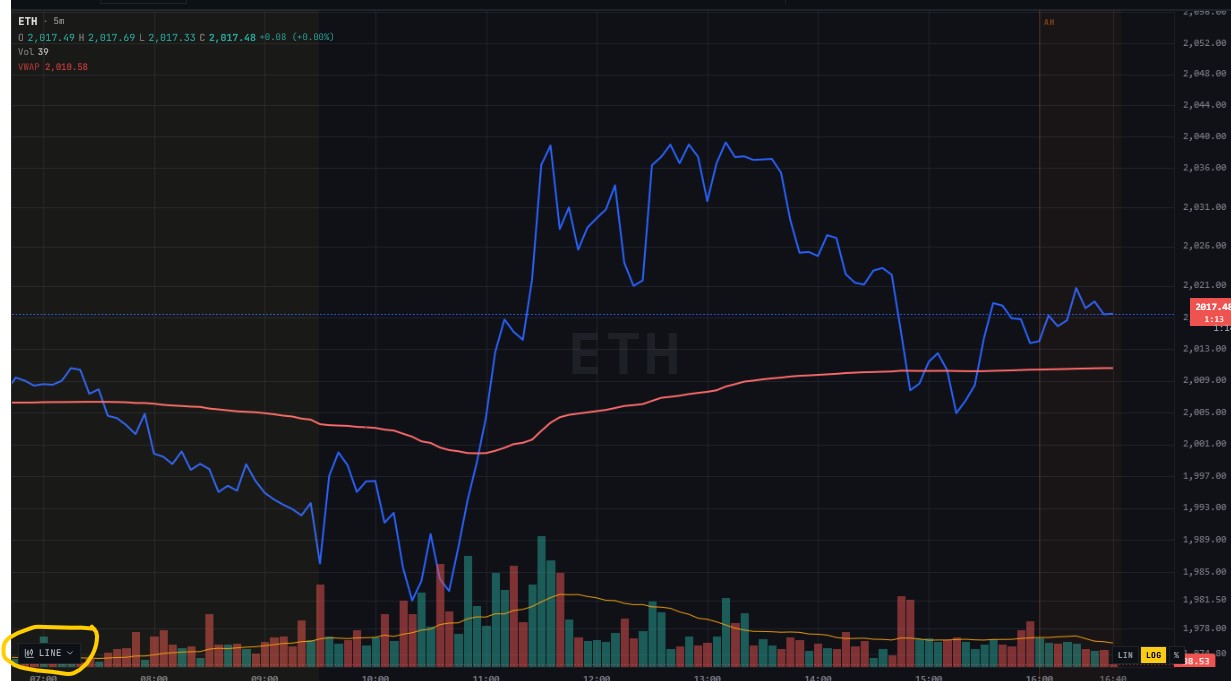
| Line | Plots closing price only as a continuous line. Cleanest view for macro trend reading; loses open/high/low detail. |
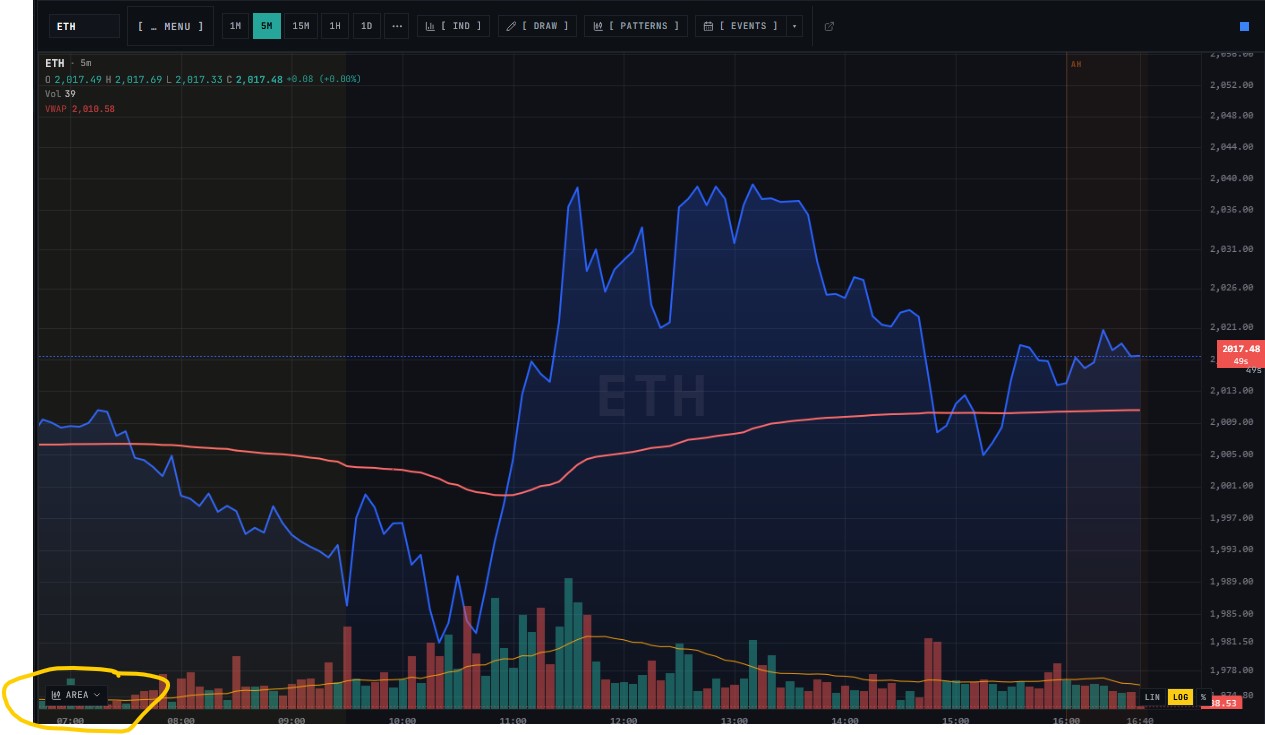
| Area | Closing price line with a filled area below. Useful for quick visual comparison of price ranges over time. |
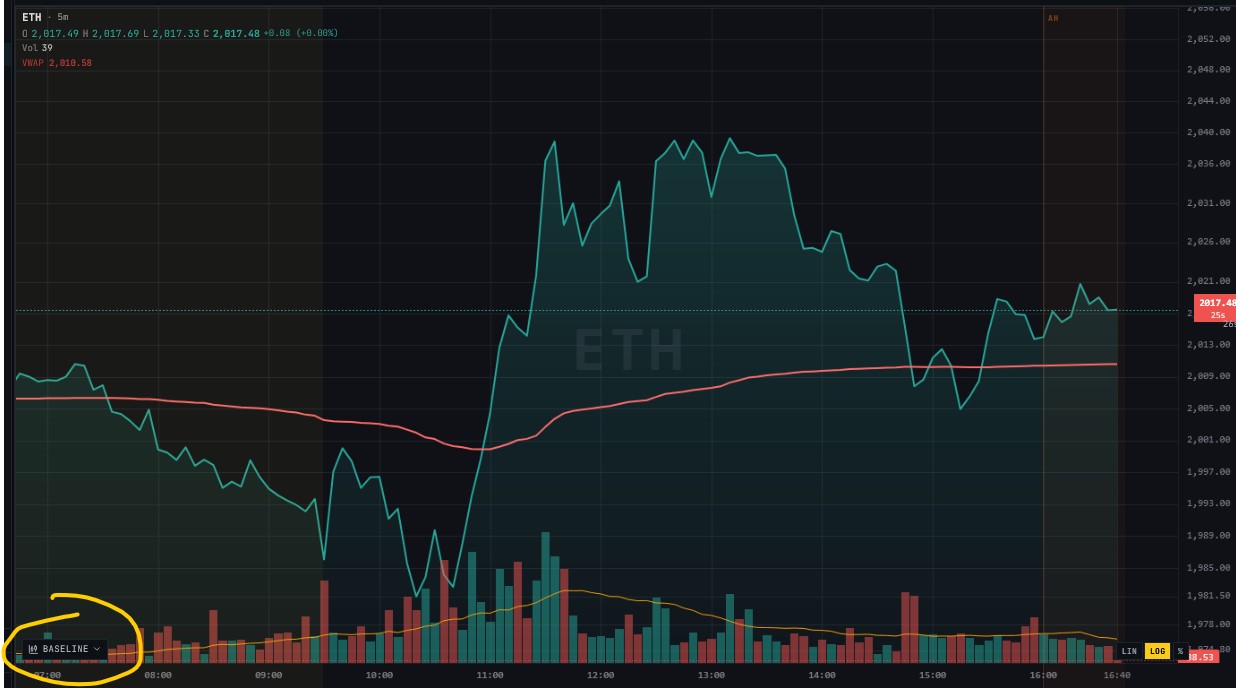
| Baseline | Plots price relative to a reference level (typically session open or VWAP). Values above the baseline are bullish; below are bearish. |
Heikin Ashi¶
Bars¶
Line¶
Area¶
Baseline¶
Switching Chart Type¶
- Open any chart panel
- Click the chart-type selector in the top-left toolbar (defaults to Candles)
- Select the desired mode from the dropdown: Candles, Heikin Ashi, Bars, Line, Area, or Baseline
The selection persists for the current session. Each chart panel can be set to a different type independently.