§00 SCANNER - Crypto Trading Dashboard Guide¶
- Crypto: 24/7 crypto trading layout — Binance-fed charts, order book, trades feed. Use this when your watchlist is BTC / ETH / SOL / etc.
1. Dashboard Overview¶
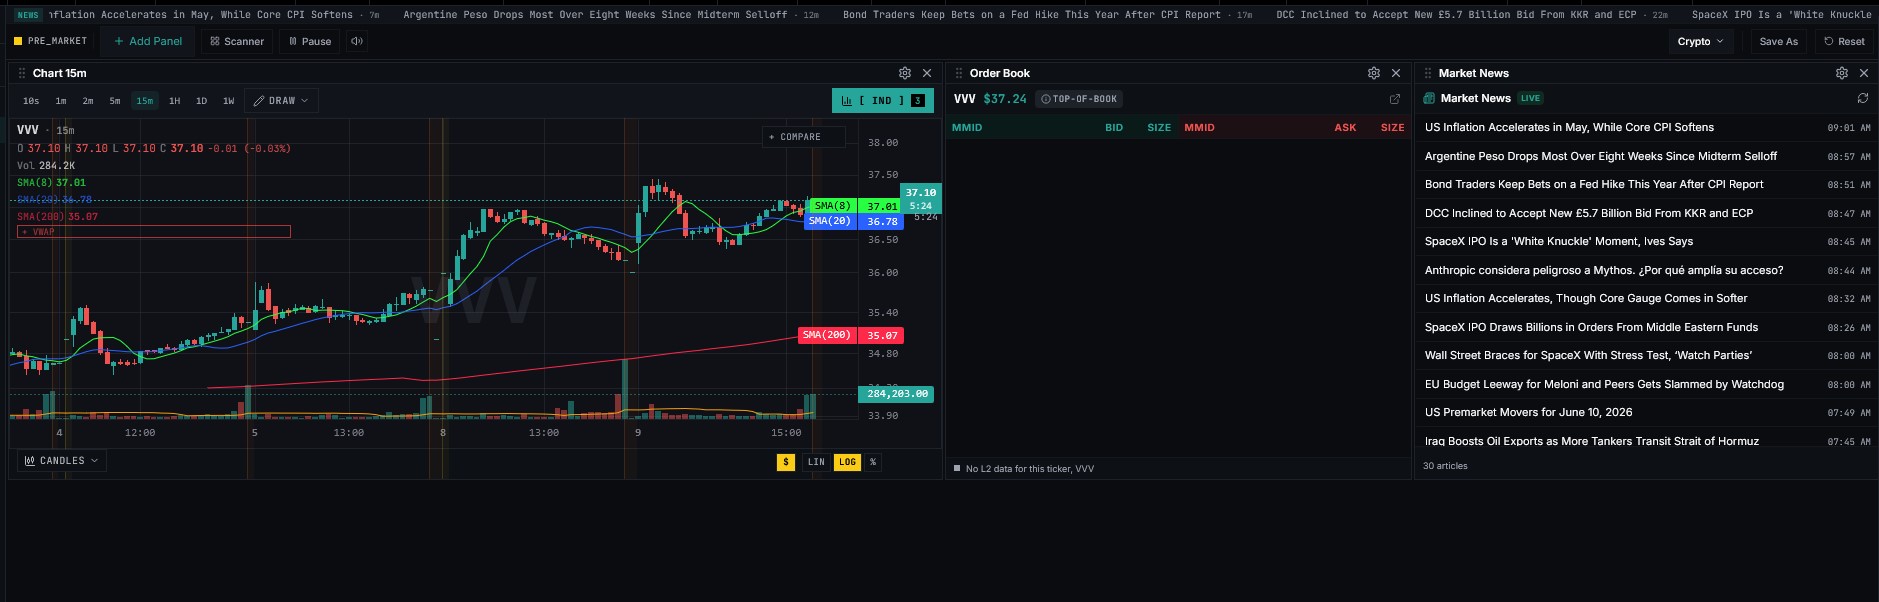
The Crypto layout is designed to monitor a selected symbol, review market depth, and follow live market headlines.
| Area | Location | Purpose |
|---|---|---|
| Top Toolbar | Top of screen | Add panels, open scanners, pause updates, save/reset the layout |
| Main Chart Panel | Left side | Shows candles, timeframe controls, indicators, and drawing tools |
| Order Book Panel | Middle | Shows bid/ask depth when Level 2 or order-book data is available |
| Market News Panel | Right side | Shows live market headlines and news updates |
| Layout Dropdown | Top-right | Shows the active Crypto workspace |
2. Top Toolbar¶
The top toolbar controls the workspace.
| Button / Menu | What It Does |
|---|---|
| Open Indicator | Shows that the platform session is active |
| + Add Panel | Adds charts, scanners, news, quotes, alerts, or other panels |
| Scanner | Opens or focuses scanner tools |
| Pause | Pauses live updates so the screen stops changing while you review |
| Sound Icon | Controls platform alerts or sounds |
| Crypto Dropdown | Shows the active layout/workspace |
| Save As | Saves your customized Crypto layout |
| Reset | Restores the layout to default |
Recommended Use¶
- Open the Crypto layout.
- Confirm the correct symbol is selected.
- Confirm the chart is receiving data.
- Confirm the order book is connected if you need depth data.
- Keep the market news panel visible for context.
- Click Save As after arranging the dashboard.
3. Main Chart Panel¶
The main chart is on the left side of the layout. In the screenshot, the chart is set to a 15-minute timeframe.
The chart panel is used to read price action, review candles, draw levels, and monitor indicators.
Visible Chart Controls¶
| Control | Purpose |
|---|---|
| 10s | 10-second chart |
| 1m | 1-minute chart |
| 2m | 2-minute chart |
| 5m | 5-minute chart |
| 15m | 15-minute chart |
| 1H | 1-hour chart |
| 1D | 1-day chart |
| 1W | 1-week chart |
| DRAW | Opens drawing tools such as lines, zones, and notes |
| Indicators Button | Opens indicator settings |
| Compare | Adds another symbol for comparison |
| Candles Menu | Changes candle style or chart display |
| LIN / LOG | Switches between linear and logarithmic chart scale |
4. Chart Data Status¶
The screenshot shows the message:
No data available for CSCO
This means the selected chart symbol is not currently returning chart data in this layout.
What To Check¶
If the chart does not load data, check the following:
| Issue | What To Do |
|---|---|
| Wrong symbol | Confirm the ticker or crypto pair is correct |
| Stock symbol used in crypto layout | Use a supported crypto symbol or pair instead |
| Data feed not connected | Refresh, retry, or check platform data permissions |
| Market type mismatch | Confirm the layout supports the selected asset |
| Temporary stream issue | Click Retry or reload the symbol |
Recommended Fix¶
- Click the symbol field or search area.
- Enter a supported crypto symbol or pair.
- Wait for the chart to load.
- If no data appears, click Retry.
- Confirm the order book updates for the same symbol.
5. Timeframe Workflow¶
Crypto trades around the clock, so timeframe selection is important.
| Timeframe | Best Use |
|---|---|
| 10s / 1m | Very fast intraday movement and entry timing |
| 2m / 5m | Short-term momentum and scalping structure |
| 15m | Balanced view for intraday trend and consolidation |
| 1H | Larger intraday direction and major levels |
| 1D | Bigger trend, major support/resistance, and market context |
| 1W | Long-term trend and major macro levels |
Suggested Beginner Process¶
- Start with 1D to understand the larger trend.
- Check 1H for major intraday levels.
- Use 15m to understand current structure.
- Use 5m for trade planning.
- Use 1m only for precise timing.
Do not make decisions from one timeframe only.
6. Candles and Chart Reading¶
Candles show how price moved during the selected timeframe.
| Candle Part | Meaning |
|---|---|
| Body | Difference between open and close |
| Upper Wick | Highest price reached during the candle |
| Lower Wick | Lowest price reached during the candle |
| Green Candle | Price closed higher than it opened |
| Red Candle | Price closed lower than it opened |
What To Look For¶
When the chart is active, review:
- Trend direction
- Highs and lows
- Support and resistance
- Breakouts and breakdowns
- Consolidation zones
- Candle size and volatility
- Volume confirmation, if volume is available
7. Drawing Tools¶
The DRAW button lets you mark important chart levels.
Useful drawing tools include:
| Tool | Use |
|---|---|
| Horizontal Line | Mark support, resistance, prior highs, and prior lows |
| Trendline | Mark rising or falling structure |
| Rectangle | Highlight consolidation or supply/demand zones |
| Text Notes | Add trade-plan reminders |
Recommended Markup¶
Before planning a crypto trade, mark:
- Daily high
- Daily low
- Prior day high
- Prior day low
- Major support
- Major resistance
- Breakout level
- Breakdown level
- Consolidation zone
8. Order Book Panel¶
The middle panel is labeled Order Book.
In the screenshot, the order book is for CSCO, and it says it is waiting for a Level 2 stream.
Order Book Columns¶
| Column | Meaning |
|---|---|
| MMID | Market maker, venue, or source identifier depending on data feed |
| Bid | Prices where buyers are waiting |
| Bid Size | Size available at bid levels |
| Ask | Prices where sellers are waiting |
| Ask Size | Size available at ask levels |
What the Screenshot Shows¶
The order book is not populated and shows a waiting message. This usually means the stream is not connected, the asset does not have available Level 2 data, or the selected symbol is not supported in this layout.
9. How To Use the Order Book¶
When order-book data is available, use it to understand liquidity.
Look for:
| Signal | Possible Meaning |
|---|---|
| Large bid size | Buyers may be waiting at that price |
| Large ask size | Sellers may be waiting at that price |
| Thin book | Price may move quickly through levels |
| Wide spread | Entry and exit may be more expensive |
| Stacked bids | Possible short-term support area |
| Stacked asks | Possible short-term resistance area |
Beginner Warning¶
The order book can change very quickly. Large orders may appear and disappear. Do not trade from the order book alone. Use it with the chart, trend, volume, and a written plan.
10. Market News Panel¶
The Market News panel is on the right side of the dashboard.
It shows live headlines and timestamps.
How To Use Market News¶
- Scan the latest headlines.
- Look for crypto-related market drivers.
- Watch for macro news that can affect risk assets.
- Compare headlines with price movement.
- Avoid reacting to a headline without checking the chart.
News That Can Affect Crypto¶
| News Type | Why It Matters |
|---|---|
| Bitcoin ETF news | Can affect BTC sentiment and liquidity |
| Regulatory headlines | Can cause fast market-wide moves |
| Interest-rate news | Can affect risk appetite |
| Inflation data | Can move crypto, stocks, and the dollar |
| Exchange news | Can affect trust and liquidity |
| Security incidents | Hacks or exploits can create sharp volatility |
| Large company adoption | Can create sector-wide attention |
11. Crypto Layout Workflow¶
Use this process when starting a crypto monitoring session.
Step 1: Open the Crypto Layout¶
- Select Crypto from the layout dropdown.
- Confirm the chart, order book, and news panels are visible.
- Confirm the chart is not paused.
Step 2: Load a Supported Symbol¶
- Enter a supported crypto symbol or pair.
- Confirm chart data loads.
- Confirm the order book updates if depth data is available.
- If data does not load, click Retry or select another supported symbol.
Step 3: Check Larger Context¶
Review:
- 1D trend
- 1H structure
- 15m setup
- Key support and resistance
- Recent volatility
- News headlines
Step 4: Check Short-Term Structure¶
Use the 5m or 15m chart to identify:
- Trend direction
- Breakout levels
- Breakdown levels
- Consolidation areas
- Pullback zones
- Failed breakouts
- Failed breakdowns
Step 5: Review Liquidity¶
Use the order book to check:
- Bid/ask spread
- Size at key levels
- Thin or thick liquidity
- Whether price can move cleanly
Step 6: Build a Plan¶
Before trading or paper trading, define:
- Entry price
- Stop price
- Target price
- Position size
- Maximum loss
- Reason for the trade
- Reason to exit
12. Example: Reading the Screenshot¶
The screenshot shows the Crypto layout, but the selected symbol appears to be CSCO, which is a stock symbol rather than a crypto pair.
Visible observations:
- The chart panel says No data available for CSCO.
- A Retry button is shown.
- The order book is also set to CSCO.
- The order book says it is waiting for a Level 2 stream.
- The Market News panel is active and showing live headlines.
- The active layout dropdown shows Crypto.
A cautious interpretation: the layout is open correctly, but the selected symbol does not appear to be providing data in the Crypto workspace. The next step is to load a supported crypto symbol or pair and confirm chart/order-book data.
13. Good Crypto Monitoring Checklist¶
Before making any decision, confirm:
- Correct crypto symbol or pair is loaded
- Chart data is updating
- Order book data is available if needed
- Spread is acceptable
- Liquidity is sufficient
- Larger timeframe trend is checked
- Key support and resistance are marked
- Recent news is reviewed
- Entry, stop, and target are planned
- Maximum loss is acceptable
14. Common Crypto Layout Mistakes¶
| Mistake | Why It Is Risky |
|---|---|
| Using an unsupported symbol | Chart and order book may show no data |
| Trading from one timeframe | You may miss major trend context |
| Ignoring spread | Entry and exit may be worse than expected |
| Relying only on order-book size | Liquidity can disappear quickly |
| Ignoring news | Crypto can react sharply to headlines |
| Overtrading low-liquidity periods | Moves can be choppy and unreliable |
| No stop or risk plan | Losses can grow quickly |
| Chasing sudden candles | Fast moves can reverse immediately |
15. Practice Routine¶
Use this routine for learning the Crypto layout.
- Open the Crypto layout.
- Load one supported crypto symbol or pair.
- Check the 1D chart.
- Check the 1H chart.
- Check the 15m chart.
- Mark support and resistance.
- Review the news panel.
- Check order-book liquidity.
- Write a sample trade plan.
- Watch what price does without entering.
- Review whether your idea was correct.
This builds skill without rushing into trades.
16. Crypto Watchlist Template¶
| Symbol | Trend | Key Support | Key Resistance | Spread | Liquidity | News Driver | Bias | Plan |
|---|---|---|---|---|---|---|---|---|
| BTC | ||||||||
| ETH | ||||||||
| SOL |
17. Recommended Crypto Layout¶
A simple beginner layout should include:
| Panel | Recommended Use |
|---|---|
| Main Chart | Read trend and levels |
| Order Book | Check spread and liquidity |
| Market News | Monitor headlines and catalysts |
| Alerts | Add later for key levels |
| Quote Panel | Add later if available for the selected asset |
Keep the screen simple at first. Add more panels only after you understand what each panel contributes.
18. Final Notes¶
The Crypto layout is best used for monitoring, chart analysis, liquidity review, and news awareness.
Use it to:
- Load supported crypto symbols
- Review multiple timeframes
- Mark support and resistance
- Watch spread and liquidity
- Monitor market headlines
- Build a written plan before trading
A good crypto rule: correct symbol first, live data second, liquidity third, plan last.