§00 SCANNER - Swing Trading Dashboard Guide¶
- Swing Trading: Multi-day position management — daily/weekly charts, fundamentals, news, calendar. Less screen-time, more research per ticker.
1. Dashboard Overview¶
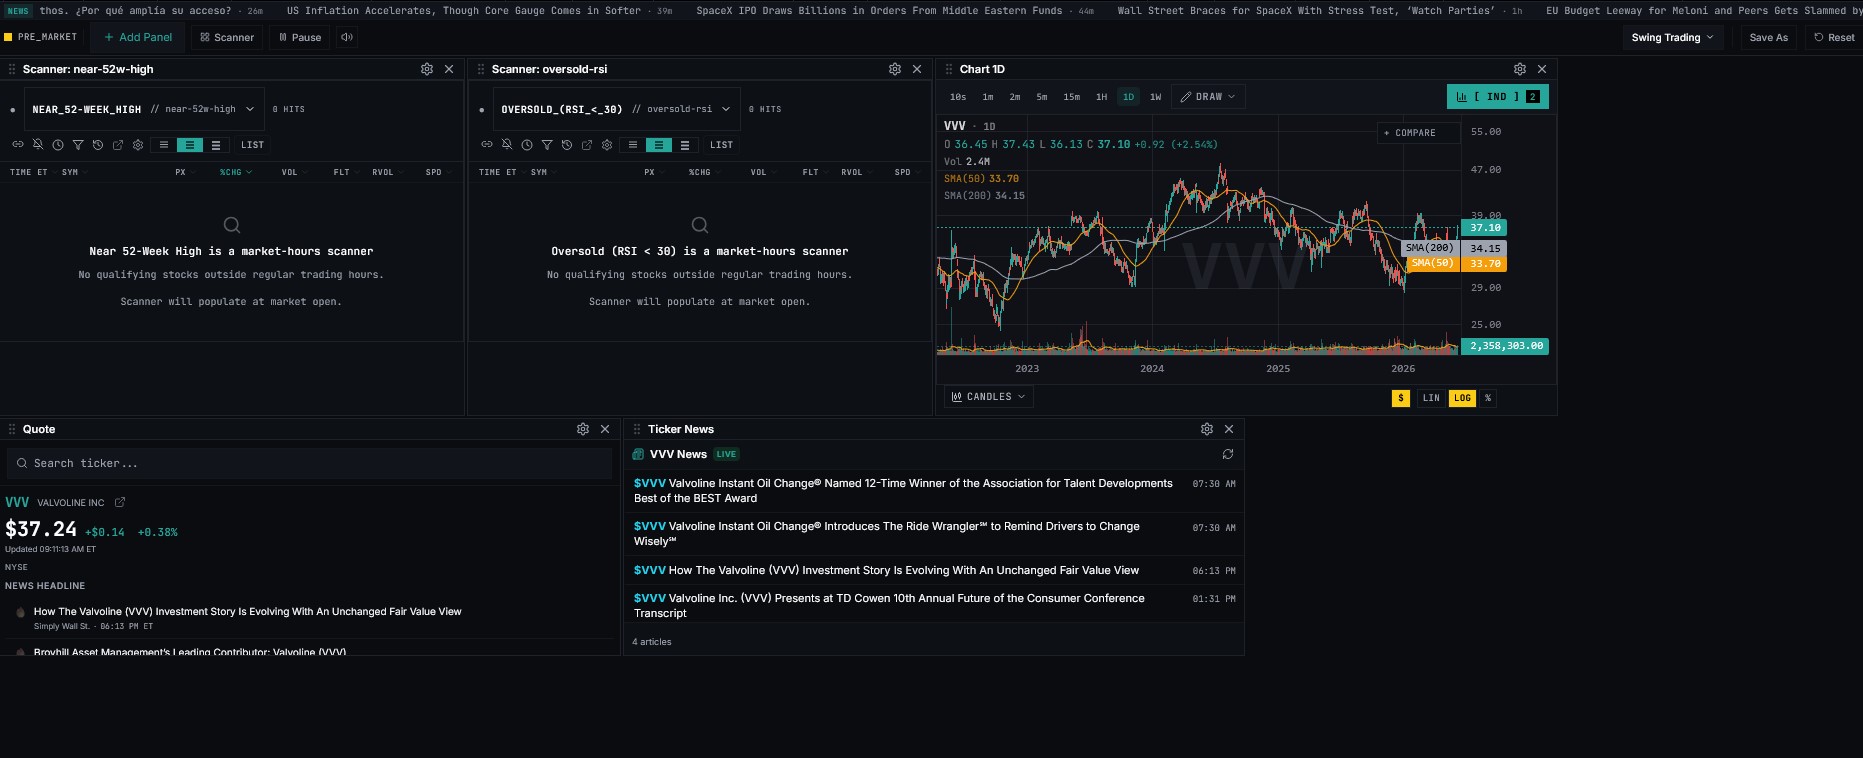
The Swing Trading layout is designed to help find stocks that may be setting up for multi-day or multi-week moves.
| Area | Location | Purpose |
|---|---|---|
| Top Toolbar | Top of screen | Add panels, open scanners, pause updates, save/reset layout |
| Near 52-Week High Scanner | Top-left | Finds stocks trading close to or breaking toward 52-week highs |
| Oversold RSI Scanner | Top-middle | Finds stocks that may be oversold based on RSI criteria |
| Daily Chart | Top-right | Shows the larger trend and swing-trade structure |
| Quote Panel | Bottom-left | Shows ticker details, price, percentage move, and simulated position information |
| Ticker News Panel | Bottom-middle | Shows ticker-specific headlines and related articles |
| Layout Dropdown | Top-right | Shows the active Swing Trading workspace |
2. Top Toolbar¶
The toolbar controls the workspace.
| Button / Menu | What It Does |
|---|---|
| Open Indicator | Shows that the market is open |
| + Add Panel | Adds charts, scanners, watchlists, quotes, news, or order-entry panels |
| Scanner | Opens or focuses scanner tools |
| Pause | Pauses live updates while you review the screen |
| Sound Icon | Controls alerts or sound |
| Swing Trading Dropdown | Shows the active workspace/layout |
| Save As | Saves the current layout |
| Reset | Restores the default layout |
Recommended Use¶
- Open the Swing Trading layout.
- Keep scanners, daily chart, quote, and ticker news visible.
- Use the dashboard for research and watchlist building.
- Save the layout after arranging panels.
- Avoid placing trades directly from a scanner without checking the daily chart and news.
3. Near 52-Week High Scanner¶
The left scanner is labeled Scanner: near-52w-high.
This scanner is designed to find stocks trading near their 52-week highs. These symbols may be showing long-term strength or preparing for a breakout.
Scanner Columns¶
| Column | Meaning |
|---|---|
| Time | Time the symbol appeared in the scanner |
| Sym | Ticker symbol |
| Px | Current or last price |
| %Chg | Percentage change |
| Vol | Current volume |
| Flt | Float, or approximate shares available for public trading |
| RVol | Relative volume compared with normal volume |
What the Screenshot Shows¶
The scanner includes symbols such as RYOJ, BDJX, PNT, HUBC, and GXAI.
It also shows a warning message: No stocks currently match Near 52-Week High criteria. Showing top movers as fallback.
That means the scanner may not currently have exact matches, so it is showing alternative active movers instead.
How to Use It¶
- Look for stocks near 52-week highs with strong volume.
- Check whether the move is supported by news or earnings.
- Open the daily chart.
- Mark major resistance and support.
- Avoid chasing a stock that is already too extended.
- Add the best setups to a watchlist.
4. Oversold RSI Scanner¶
The middle scanner is labeled Scanner: oversold-rsi.
This scanner is intended to find stocks that may be oversold using RSI criteria, such as RSI below 30.
What RSI Means¶
RSI stands for Relative Strength Index. It is a momentum indicator that attempts to measure whether a stock is overbought or oversold.
| RSI Area | Common Interpretation |
|---|---|
| Above 70 | Potentially overbought |
| Around 50 | Neutral or balanced |
| Below 30 | Potentially oversold |
Screenshot Example¶
The scanner shows WNT as an oversold RSI candidate with a negative percentage move.
How to Use It¶
- Treat oversold RSI as a watchlist signal, not a buy signal.
- Open the daily chart.
- Check whether price is near support.
- Check whether the downtrend is slowing.
- Look for reversal confirmation.
- Read the news before assuming a bounce.
Important Warning¶
A stock can stay oversold for a long time. Do not buy only because RSI is below 30. Confirm with chart structure, volume, news, and risk management.
5. Scanner Controls¶
Each scanner includes small control icons near the top.
| Control | Purpose |
|---|---|
| Link Icon | Links scanner selection to another panel, such as chart or quote |
| Refresh Icon | Refreshes scanner results |
| Filter Icon | Opens scan filters |
| Settings Gear | Opens scanner settings |
| Grid/List Icons | Changes the display style |
| List Button | Shows results as a list |
Suggested Scanner Sorting¶
| Sort By | Why It Helps |
|---|---|
| %Chg | Finds strong movers |
| Vol | Finds liquid stocks |
| RVol | Finds unusual activity |
| Px | Helps filter by preferred price range |
| Flt | Helps identify low-float volatility risk |
6. Daily Chart Panel¶
The main chart shows CSCO on a 1-day timeframe.
Daily charts are the most important chart type for swing trading because they show the larger trend and major levels.
Visible Chart Elements¶
| Element | Purpose |
|---|---|
| Candles | Show daily price movement |
| Volume Bars | Show daily trading volume |
| SMA(50) | 50-day simple moving average |
| SMA(200) | 200-day simple moving average |
| Draw Tool | Adds support, resistance, trendlines, and notes |
| Indicator Button | Opens indicators |
| Linear / Log Toggle | Changes chart scale |
Timeframe Buttons¶
| Button | Meaning |
|---|---|
| 10s / 1m / 2m / 5m / 15m | Short-term intraday views |
| 1H | Hourly chart |
| 1D | Daily chart |
| 1W | Weekly chart |
Swing Trading Timeframe Workflow¶
- Start with the weekly chart for major trend and long-term levels.
- Use the daily chart for the main setup.
- Use the 1-hour chart for entry timing if needed.
- Avoid making swing decisions from only a 1-minute or 5-minute chart.
7. SMA(50) and SMA(200)¶
The chart shows SMA(50) and SMA(200).
These are common long-term trend indicators.
| Indicator | Meaning |
|---|---|
| SMA(50) | Average closing price over approximately 50 trading days |
| SMA(200) | Average closing price over approximately 200 trading days |
How to Read Them¶
| Price Behavior | Possible Interpretation |
|---|---|
| Price above SMA(50) and SMA(200) | Stock may be in a stronger uptrend |
| Price below SMA(50) and SMA(200) | Stock may be in a weaker trend |
| SMA(50) above SMA(200) | Longer-term trend may be improving |
| SMA(50) below SMA(200) | Longer-term trend may be weakening |
| Price extended far above SMA(50) | Stock may be overheated or due for a pullback |
Do not trade based on moving averages alone. Use them with support, resistance, volume, catalysts, and risk.
8. Quote Panel¶
The quote panel in the lower-left shows the selected ticker, CSCO.
Quote Panel Fields¶
| Field | Meaning |
|---|---|
| Ticker | Selected symbol |
| Company Name | Full company name |
| Current Price | Latest quoted price |
| Dollar Change | Price movement in dollars |
| Percent Change | Price movement as a percentage |
| Exchange | Exchange where the stock trades |
| News Headline | Recent headline area |
| Simulation Box | Shows simulated shares and estimated P&L if using paper/simulation mode |
Screenshot Example¶
The quote panel shows CSCO trading around $127.40, with a positive move. It also shows a simulated position line for shares and estimated profit.
How to Use It¶
- Confirm you are viewing the correct ticker.
- Check current price and percentage move.
- Compare price with the daily chart.
- Check whether you already have a simulated or real position.
- Review news before planning a swing trade.
9. Ticker News Panel¶
The bottom-middle panel shows CSCO News.
This panel displays ticker-specific news headlines that may explain a move or affect the swing-trade thesis.
How to Use Ticker News¶
- Read the latest ticker-specific headlines.
- Check whether news supports or weakens the chart setup.
- Look for earnings, guidance, analyst notes, product news, or macro-related stories.
- Avoid holding into major events unless that risk is part of the plan.
- Use news as context, not as the only reason for a trade.
Common Swing Trading News Catalysts¶
| Catalyst | Why It Matters |
|---|---|
| Earnings | Can reset the trend or create large gaps |
| Guidance | Changes expectations for future performance |
| Analyst upgrades/downgrades | Can affect sentiment |
| Product announcements | Can support a longer-term story |
| Sector strength or weakness | Can lift or pressure related stocks |
| Mergers/acquisitions | Can cause large price changes |
| Regulatory news | Can create high uncertainty |
10. Example: Reading CSCO in the Screenshot¶
The screenshot shows CSCO selected.
Visible observations:
- CSCO is shown on the daily chart.
- Price is around $127.40 in the quote panel.
- The daily chart shows a strong uptrend.
- Price is trading above the moving averages shown on the chart.
- The chart shows a recent push into higher levels.
- The news panel shows positive-sounding headlines related to strong share performance and AI infrastructure momentum.
- The quote panel shows a simulated position line.
A cautious read: CSCO appears to be in a strong longer-term trend, but it may be extended after a strong run. A swing trader would normally look for a clean pullback, consolidation, or breakout setup with a defined stop rather than buying randomly after a large move.
11. Swing Trading Research Workflow¶
Use this workflow when building a swing-trading watchlist.
Step 1: Open the Swing Trading Layout¶
- Select Swing Trading from the layout dropdown.
- Confirm the scanners are visible.
- Confirm the chart is set to 1D.
- Confirm quote and ticker news panels are visible.
Step 2: Review the Scanners¶
Start with:
- Near 52-Week High for strength setups.
- Oversold RSI for possible bounce or reversal setups.
Do not treat scanner results as automatic trade signals.
Step 3: Load a Candidate¶
- Click a ticker from a scanner.
- Confirm the ticker loads in the chart.
- Confirm the ticker loads in the quote and news panels.
Step 4: Check the Daily Chart¶
Review:
- Trend direction
- SMA(50)
- SMA(200)
- Recent highs and lows
- Support and resistance
- Volume pattern
- Breakout or pullback structure
- Whether price is extended
Step 5: Check the Weekly Chart¶
Use the weekly chart to identify:
- Major long-term resistance
- Major support
- Long-term trend
- Multi-year breakout zones
- Whether price has room to move
Step 6: Review News¶
Look for:
- Earnings date
- Recent headlines
- Analyst actions
- Sector catalysts
- Company-specific risks
- Upcoming events
Step 7: Build a Trade Plan¶
Before entering, define:
- Entry price
- Stop price
- Target price
- Position size
- Maximum loss
- Expected holding period
- Reason for entry
- Reason to exit
12. Strong Swing Candidate Checklist¶
A stronger swing candidate usually has:
- Clean daily trend
- Strong or improving weekly chart
- Clear support and resistance
- Good volume confirmation
- Reasonable spread and liquidity
- Clear catalyst or strong sector context
- Defined entry level
- Defined stop level
- Realistic target
- Acceptable overnight risk
- No major event risk that you do not want to hold through
13. 52-Week High Setup Checklist¶
For stocks near a 52-week high, check:
- Is the stock breaking out or just extended?
- Is volume above average?
- Is the breakout level clear?
- Is there a nearby support level?
- Is there room to move on the weekly chart?
- Is the sector strong?
- Is the stop distance reasonable?
- Is there a catalyst supporting the move?
14. Oversold RSI Setup Checklist¶
For oversold RSI candidates, check:
- Is price near support?
- Is the selling volume decreasing?
- Is there a reversal candle or base forming?
- Is the news negative or temporary?
- Is the stock in a long-term downtrend?
- Is there a clear stop level?
- Is the bounce target realistic?
- Are you buying strength confirmation, not just weakness?
15. Risk Management Checklist¶
Before placing a swing trade, confirm:
- Correct ticker
- Correct account mode
- Correct order type
- Correct quantity
- Entry is defined
- Stop is defined
- Target is defined
- Maximum loss is acceptable
- Holding period is planned
- Earnings date is checked
- News risk is checked
- Daily and weekly charts are reviewed
- Position size fits overnight risk
16. Common Swing Trading Mistakes¶
| Mistake | Why It Is Risky |
|---|---|
| Buying only because a stock is near a 52-week high | It may be extended and due for a pullback |
| Buying only because RSI is oversold | Weak stocks can stay oversold |
| Ignoring earnings dates | Earnings can gap against the position |
| Ignoring the weekly chart | You may miss major resistance |
| Using too much size | Overnight gaps can create larger losses |
| No stop plan | Losses can grow over several days |
| Holding after the reason for the trade is gone | The thesis may no longer be valid |
| Chasing a big green candle | Risk/reward may be poor |
| Ignoring volume | Breakouts without volume often fail |
17. Practice Routine¶
Use this routine in paper trading or watchlist mode.
- Open the Swing Trading layout.
- Pick three candidates from the scanners.
- Open each on the daily chart.
- Check the weekly chart.
- Mark support, resistance, SMA(50), and SMA(200).
- Read ticker news.
- Write a swing plan for one candidate.
- Track the setup for several days.
- Record whether the plan worked.
- Review what the chart taught you.
18. Swing Trading Watchlist Template¶
| Ticker | Setup Type | Price | Trend | Key Support | Key Resistance | Stop | Target | Catalyst | Notes |
|---|---|---|---|---|---|---|---|---|---|
| CSCO | 52W high / trend | Uptrend | News / momentum | ||||||
| Oversold RSI |
19. Recommended Swing Trading Layout¶
For a clean swing-trading workflow, keep these panels visible:
| Panel | Recommended Use |
|---|---|
| Near 52-Week High Scanner | Find strength and breakout candidates |
| Oversold RSI Scanner | Find possible reversal or bounce candidates |
| Daily Chart | Main swing-trade decision chart |
| Quote Panel | Confirm price, symbol, and position status |
| Ticker News | Review catalyst and risk |
| Weekly Chart | Add if you want broader context |
Avoid overcrowding the screen. Swing trading is slower than day trading, so the layout should support analysis rather than fast clicking.
20. Final Notes¶
The Swing Trading layout is best used for structured research and watchlist building.
Use it to:
- Find strong stocks near 52-week highs
- Find oversold candidates for possible reversals
- Study daily and weekly trends
- Review moving averages
- Check ticker-specific news
- Build a written trade plan
- Manage risk over multiple days
A good swing trading rule: scanner first, daily chart second, weekly chart third, news fourth, plan last.