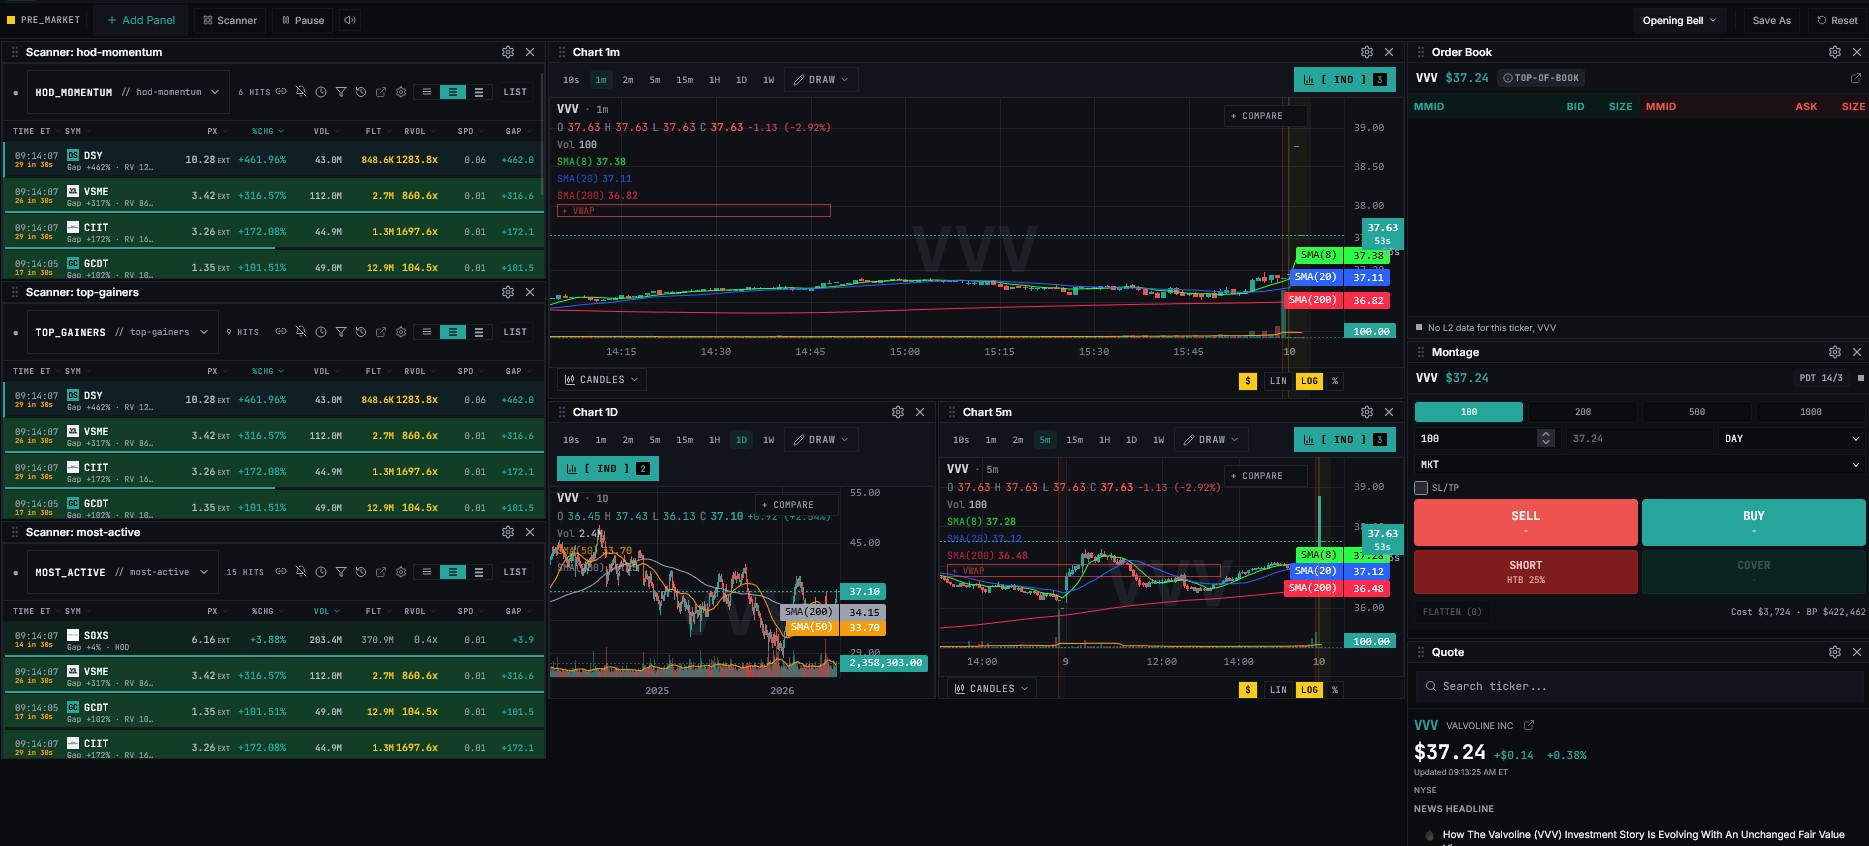
§00 SCANNER - Opening Bell Trading Dashboard Guide¶
- Opening Bell: First-30-minute volatility — scanner, momentum-leaders chart, L2, time & sales. Optimized for the 9:30-10:00am ET open auction window.
1. Classical Chart Patterns¶
Double Top / Double Bottom (Reversal Patterns)¶
- Description: A Double Top occurs when the price reaches a high point twice with a moderate decline between the two peaks. It signals a bearish reversal. Conversely, a Double Bottom consists of two distinct lows separated by a peak, signaling a bullish reversal.
- Market Psychology:
- Double Top: Buyers attempt to push the price to new highs but meet strong resistance at the previous peak, signaling exhausting demand.
- Double Bottom: Sellers attempt to push the price lower but are met with aggressive buying at the previous low, signaling institutional accumulation.
- Execution Strategy:
- Entry: Enter short (Double Top) or long (Double Bottom) upon a confirmed breakout and close past the "neckline" (the intermediate trough or peak).
- Stop Loss: Placed just above the second peak (Double Top) or below the second trough (Double Bottom).
- Profit Target: Measure the vertical distance from the neckline to the peaks/troughs, and project that same distance from the breakout point.
Head and Shoulders (Standard & Inverse)¶
- Description: A Head and Shoulders pattern features three peaks: a higher peak (head) between two lower peaks (shoulders). The Inverse Head and Shoulders features three troughs with the middle one being the deepest.
- Market Psychology: Represents a structural shift from an established trend to a state of equilibrium, followed by a trend reversal as momentum completely flips.
- Execution Strategy:
- Entry: Enter on a decisive close below the neckline (Standard) or above the neckline (Inverse).
- Stop Loss: Placed above the right shoulder (Standard) or below the right shoulder (Inverse).
- Profit Target: Equal to the vertical distance from the head to the neckline, projected from the breakout level.
Triangles (Ascending, Descending, Symmetrical)¶
- Description:
- Ascending Triangle: A flat upper resistance line with a rising lower support line (typically bullish).
- Descending Triangle: A flat lower support line with a falling upper resistance line (typically bearish).
- Symmetrical Triangle: Two converging trendlines forming a cone, representing a period of compression and volatility contraction.
- Market Psychology: Shows a battle between buyers and sellers where one side is aggressively stepping up their execution floor/ceiling (ascending/descending) or both sides are compressing into a coiled spring (symmetrical).
- Execution Strategy:
- Entry: Avoid trading inside the apex. Enter on a clean breakout candle closing outside the boundary trendlines.
- Stop Loss: Placed inside the triangle structure, just beyond the opposite trendline or the most recent swing minor high/low.
- Profit Target: Measure the widest part of the triangle (the base) and project that distance from the breakout point.
2. Candlestick Formations¶
Engulfing Patterns (Bullish & Bearish)¶
- Description: A two-candle pattern where the body of the second candle completely overlaps or "engulfs" the body of the first candle.
- Market Psychology: Demonstrates an immediate, aggressive shift in sentiment. For a Bullish Engulfing, sellers dominate early, but buyers overwhelm them completely by the session close.
- Execution Strategy:
- Entry: Enter at the open of the third candle following the completion of the engulfing bar.
- Stop Loss: Below the low of the engulfing candle (Bullish) or above the high of the engulfing candle (Bearish).
Hammer & Inverted Hammer / Shooting Star¶
- Description: Single candles characterized by small bodies and long wicks (at least twice the length of the body). A Hammer occurs at the bottom of a markdown trend; a Shooting Star occurs at the top of an uptrend.
- Market Psychology: Represents rejection of high or low prices. A Shooting Star shows that buyers pushed prices aggressively higher, but sellers returned in massive force to slam the price back down to close near the open.
- Execution Strategy:
- Entry: Wait for confirmation on the subsequent candle (e.g., a bearish follow-through candle after a Shooting Star).
- Stop Loss: Placed strictly beyond the tip of the long wick.
3. Technical Indicators & Oscillators¶
Moving Averages (SMA & EMA)¶
- Description: Trend-following lines that smooth out price action data. Simple Moving Average (SMA) calculates the average price over a set period, while the Exponential Moving Average (EMA) places a heavier weight on recent prices.
- Core Concepts:
- Golden Cross: 50-day moving average crosses above the 200-day moving average (Long-term Bullish).
- Death Cross: 50-day moving average crosses below the 200-day moving average (Long-term Bearish).
- Execution Strategy: Use moving averages as dynamic support and resistance zones. Look to buy pullbacks to a rising 20-EMA or 50-SMA during strong trends.
Relative Strength Index (RSI)¶
- Description: A momentum oscillator that measures the speed and change of price movements on a scale from 0 to 100.
- Key Levels:
- Overbought (>70): Signals that the asset may be overextended to the upside and due for a pullback or consolidation.
- Oversold (<30): Signals that the asset may be overextended to the downside and due for a technical bounce.
- Advanced Use (Divergence):
- Bullish Divergence: Price makes a lower low, but RSI makes a higher low. Indicates weakening downward momentum.
- Bearish Divergence: Price makes a higher high, but RSI makes a lower high. Indicates weakening upward momentum.
MACD (Moving Average Convergence Divergence)¶
- Description: A trend-following momentum indicator showing the relationship between two moving averages of an asset’s price (usually the 12 EMA and 26 EMA), paired with a Signal Line (9 EMA) and a Histogram.
- Execution Strategy:
- Bullish Signal: MACD Line crosses above the Signal Line from below, and the histogram flips from negative to positive.
- Bearish Signal: MACD Line crosses below the Signal Line from above, and the histogram flips from positive to negative.
4. Risk Management Principles¶
| Metric | Target Standard | Purpose |
|---|---|---|
| Risk-to-Reward Ratio (R:R) | Minimum 1:2 | Ensures profitability even with a win rate under 50%. |
| Position Sizing | 1% - 2% of account equity per trade | Prevents catastrophic capital destruction during a losing streak. |
| Trailing Stop | ATR (Average True Range) based | Locks in profits while allowing the macro trend to breathe. |
Documentation Best Practice
Always pair pattern identification with volume confirmation. A breakout on low volume is highly prone to becoming a "bull trap" or "bear trap". Ensure volume spikes as the price breaks past critical structural levels.