§00 SCANNER - DAS Pro Trading Dashboard Guide¶
- DAS Pro: Day-trading cockpit inspired by Warrior Trading / DAS Trader Pro. Compact montage for order entry + paper trading + chart + scanner + time & sales — the classic active-trader 6-panel layout.
1. Dashboard Overview¶
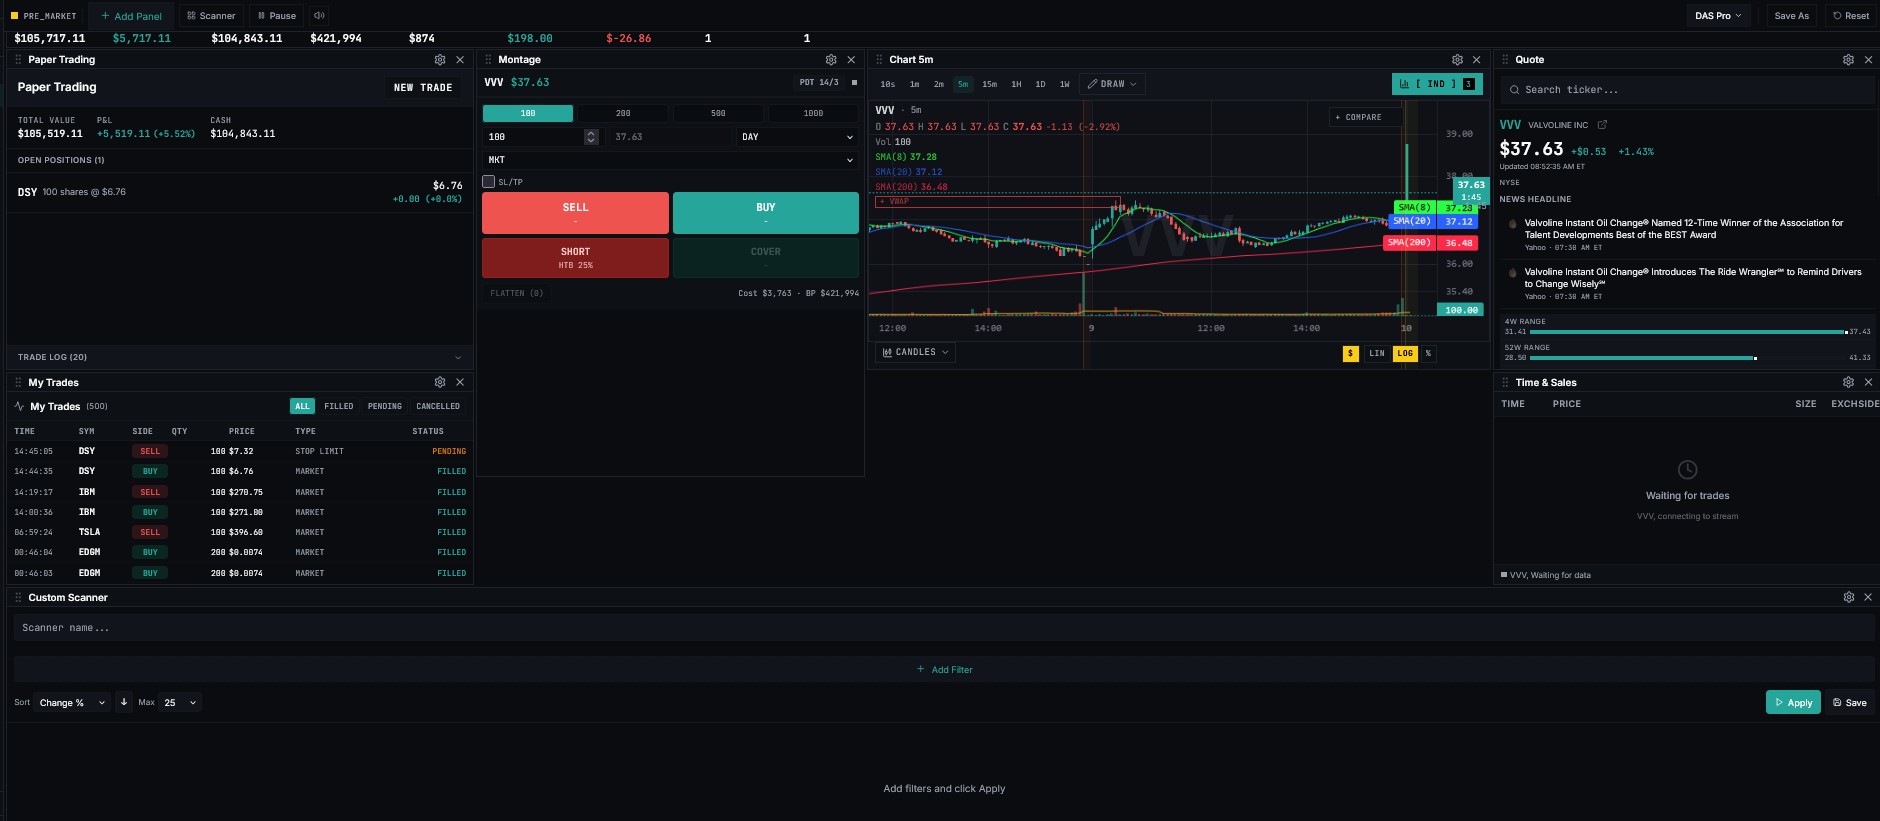
The layout is divided into several main areas:
| Area | Location | Purpose |
|---|---|---|
| Top Toolbar | Top of screen | Add panels, open scanners, pause data, save/reset layouts |
| Account & Metrics | Top row | Shows account value, cash, buying power, P&L, positions, and open orders |
| Paper Trading Panel | Left side | Shows paper account status, open positions, and trade log |
| Montage / Order Entry | Middle-left | Main trading ticket for buy, sell, short, cover, and order settings |
| Chart Panel | Center | Shows price action, candles, volume, moving averages, and drawings |
| Quote Panel | Right side | Shows ticker details, price, change, news, range, volume, and previous close |
| Time & Sales | Lower-right | Shows live trade prints when streaming data is active |
| Custom Scanner | Bottom | Lets you build scanner filters and search for trade candidates |
2. Top Toolbar¶
The top toolbar controls the workspace.
| Button / Menu | What It Does |
|---|---|
| + Add Panel | Adds another widget or trading panel |
| Scanner | Opens or focuses a scanner window |
| Pause | Pauses live updates so the screen stops changing while you review |
| Sound Icon | Controls alert or sound behavior |
| DAS Pro Dropdown | Shows the active layout/workspace |
| Save As | Saves the current dashboard layout |
| Reset | Resets the layout back to default |
Recommended Setup Workflow¶
- Open the DAS Pro layout.
- Keep the chart, montage, account, quote, and trade log visible.
- Add scanner panels only when you need them.
- Save your layout after arranging the screen.
- Use reset only if the layout becomes cluttered or unusable.
3. Account & Metrics Panel¶
The top row gives a fast account summary.
| Metric | Meaning |
|---|---|
| Equity | Total current account value |
| Day P&L | Profit or loss for the current trading day |
| Cash | Cash available in the account |
| BP Avail | Buying power available |
| BP Used | Buying power currently being used |
| Unrealized | Profit or loss on open positions |
| Realized | Profit or loss from closed trades |
| Positions | Number of open positions |
| Open Orders | Number of orders currently waiting to execute |
How to Use This Panel¶
Before placing any trade, check:
- Day P&L
- Available buying power
- Open positions
- Open orders
- Realized and unrealized P&L
If you see unexpected open orders or positions, stop and review before placing another trade.
4. Paper Trading Panel¶
The screenshot shows the account in Paper Trading mode.
This is the safest place to practice because trades do not use real money.
Main Sections¶
| Section | Purpose |
|---|---|
| Total Value | Total simulated account value |
| P&L | Current paper trading profit/loss |
| Cash | Available paper cash |
| Open Positions | Shows current holdings |
| Trade Log | Shows previous trades and order activity |
| My Trades | Lists trade history, status, price, quantity, and side |
Trade Log Statuses¶
| Status | Meaning |
|---|---|
| Filled | Order executed successfully |
| Pending | Order was submitted but not filled yet |
| Cancelled | Order was cancelled |
| Stop Loss | Stop order was used or cancelled |
| Market | Market order type was used |
Best Practice¶
Use paper trading to test:
- Placing market orders.
- Placing limit orders.
- Setting stop losses.
- Using bracket orders.
- Closing positions.
- Reading the trade log after each action.
Do not switch to live trading until you can explain every order in the trade log.
5. Montage / Order Entry Panel¶
The Montage is the main order-entry panel. In the screenshot, the selected symbol is SOXS.
This is where you configure and submit trades.
Main Parts of the Montage¶
| Field / Button | Purpose |
|---|---|
| Symbol | Ticker being traded |
| Bid | Highest current buyer price |
| Ask | Lowest current seller price |
| Size Buttons | Quick share quantity presets |
| Quantity Field | Number of shares/contracts to trade |
| Price Field | Price for limit or stop orders |
| Order Type | Market, limit, stop, or another available order type |
| Time in Force | How long the order remains active |
| Bracket Checkbox | Adds stop/target order logic if supported |
| Sell | Sells shares or closes/reduces a long position |
| Buy | Buys shares or opens/increases a long position |
| Short | Opens a short position |
| Cover | Closes/reduces a short position |
| Flatten | Attempts to close the current position |
6. Buy, Sell, Short, and Cover¶
These buttons are powerful. Know what each one does before clicking.
| Button | Typical Use |
|---|---|
| Buy | Open or add to a long position |
| Sell | Close or reduce a long position |
| Short | Open a short position |
| Cover | Close or reduce a short position |
| Flatten | Close the active position as quickly as the platform allows |
Example Long Trade Workflow¶
- Type the symbol.
- Choose quantity.
- Choose order type.
- Choose price if using a limit order.
- Click Buy to enter.
- Set or confirm stop loss.
- Click Sell to exit.
Example Short Trade Workflow¶
- Type the symbol.
- Choose quantity.
- Choose order type.
- Confirm shorting is allowed for that ticker.
- Click Short to enter.
- Set or confirm stop loss.
- Click Cover to exit.
7. Order Types¶
Your screenshot shows order controls in the montage area. The exact available types may depend on the broker or simulator setup.
| Order Type | Meaning | Beginner Use |
|---|---|---|
| Market | Executes immediately at the best available price | Fast entry/exit, but can slip |
| Limit | Executes only at your price or better | Better price control |
| Stop | Triggers when price reaches a stop level | Risk control or breakout entry |
| Stop Loss | Exits a position when price moves against you | Essential risk management |
| Bracket | Combines entry, stop, and target logic | Useful for planned trades |
Beginner Recommendation¶
Use limit orders when learning because they give better price control. Market orders are faster but can fill at worse prices, especially on fast-moving or low-liquidity symbols.
8. Time in Force¶
The screenshot shows a time-in-force field, such as DAY+.
| Time in Force | Meaning |
|---|---|
| DAY | Order is active during the regular trading day |
| DAY+ | May include extended-hours support depending on broker/platform setup |
| GTC | Good until cancelled |
| IOC | Immediate or cancel |
| FOK | Fill or kill |
Always confirm your time-in-force before placing an order. Extended-hours orders can behave differently because liquidity is often lower and spreads can be wider.
9. Chart Panel¶
The chart panel is in the center of the dashboard. It shows SOXS on a 5-minute chart.
Timeframe Buttons¶
| Button | Meaning |
|---|---|
| 10s | 10-second chart |
| 1m | 1-minute chart |
| 2m | 2-minute chart |
| 5m | 5-minute chart |
| 15m | 15-minute chart |
| 1H | 1-hour chart |
| 1D | 1-day chart |
| 1W | 1-week chart |
Suggested Timeframe Process¶
- Start with 1D to understand the larger trend.
- Check 1H for broader intraday structure.
- Use 15m to identify support and resistance.
- Use 5m to plan a trade.
- Use 1m or 2m only for precise timing.
10. Candles and Volume¶
Each candle represents price movement during the selected timeframe.
For a 5-minute chart, each candle represents 5 minutes.
| Candle Part | Meaning |
|---|---|
| Body | Open-to-close price range |
| Wick | High and low during the candle |
| Green Candle | Price closed higher than it opened |
| Red Candle | Price closed lower than it opened |
Volume bars appear at the bottom of the chart.
| Volume Behavior | Possible Meaning |
|---|---|
| Large volume spike | Strong activity, news, volatility, or forced movement |
| Low volume | Less interest or consolidation |
| Rising volume with trend | Trend may be gaining strength |
| Falling volume after a large move | Move may be slowing or consolidating |
11. Moving Averages¶
The chart displays moving averages, including short-term EMAs.
| Indicator | Purpose |
|---|---|
| EMA(9) | Fast short-term momentum guide |
| EMA(20) | Slower short-term trend guide |
How to Read EMAs¶
- Price above both EMAs may suggest short-term strength.
- Price below both EMAs may suggest short-term weakness.
- EMA(9) above EMA(20) can suggest improving momentum.
- EMA(9) below EMA(20) can suggest weakening momentum.
- After a sharp move, price may move sideways while EMAs catch up.
Do not trade using moving averages alone. Confirm with volume, price structure, support/resistance, and risk.
12. Drawing Tools¶
The DRAW button lets you mark up the chart.
Useful drawings include:
| Tool | Use |
|---|---|
| Horizontal Line | Mark support and resistance |
| Trendline | Mark directional movement |
| Rectangle | Highlight consolidation zones |
| Text Notes | Add reminders or trade-plan notes |
Suggested Chart Markup¶
Mark these levels before planning a trade:
- High of day
- Low of day
- Premarket high
- Premarket low
- Prior day high
- Prior day low
- Major support
- Major resistance
- Breakout or breakdown level
13. Quote Panel¶
The quote panel is on the right side of the dashboard.
In the screenshot, the selected symbol is SOXS.
Quote Panel Information¶
| Field | Meaning |
|---|---|
| Ticker Name | Full name of the security |
| Current Price | Latest quoted price |
| Dollar Change | Price change in dollars |
| Percent Change | Price change as a percentage |
| Exchange | Exchange where it trades |
| News Headline | Recent headline related to the ticker |
| 52W Range | 52-week price range |
| Open | Current session opening price |
| Previous Close | Prior session close |
| Volume | Current traded volume |
| Average Volume | Normal average trading volume |
How to Use the Quote Panel¶
- Confirm you are looking at the correct ticker.
- Check the price and percentage move.
- Review volume compared with average volume.
- Check the news headline for a possible catalyst.
- Compare current price with open and previous close.
14. Time & Sales Panel¶
The Time & Sales panel shows live trade prints when streaming data is connected.
| Column | Meaning |
|---|---|
| Time | When the trade occurred |
| Price | Execution price |
| Size | Number of shares/contracts traded |
| Exchange/Side | Exchange or trade-side information, depending on setup |
How to Use Time & Sales¶
Use it to confirm activity before entering or exiting.
Look for:
- Fast printing trades
- Large trade sizes
- Price moving through key levels
- Increased activity near support or resistance
If the panel says it is waiting for trades or data, the stream may not be connected or the symbol may not be actively printing.
15. Custom Scanner Panel¶
The custom scanner is at the bottom of the screen.
It lets you build a scan by adding filters.
Visible Scanner Controls¶
| Control | Purpose |
|---|---|
| Scanner name | Name your custom scan |
| + Add Filter | Add conditions such as price, volume, change %, gap, or float |
| Sort | Choose how results are sorted |
| Max | Limit how many results appear |
| Apply | Run the scanner |
| Save | Save the scanner for later use |
Beginner Scanner Setup Ideas¶
Start simple. Avoid too many filters at once.
Example scanner filters:
| Goal | Example Filter Ideas |
|---|---|
| Find active movers | Change %, volume, relative volume |
| Find gappers | Gap %, volume |
| Avoid illiquid names | Minimum volume, maximum spread |
| Find low-priced movers | Price range, volume |
| Find clean momentum | Change %, volume, above VWAP if available |
Basic Scanner Workflow¶
- Name the scanner.
- Add one or two filters.
- Set sort to Change %, Volume, or Relative Volume.
- Set the max result count.
- Click Apply.
- Review symbols on the chart before trading.
- Save the scanner only after it returns useful results.
16. Suggested Beginner Workflow¶
Use this process for each practice session.
Step 1: Confirm Paper Trading¶
Make sure the account panel says Paper Trading before practicing.
Step 2: Check Account Risk¶
Review:
- Equity
- Cash
- Day P&L
- Open positions
- Open orders
Do not place a new trade if there are unexpected positions or pending orders.
Step 3: Choose a Symbol¶
Use one of these methods:
- Type a ticker directly in the montage.
- Select a symbol from the quote/search area.
- Use the custom scanner after filters are applied.
Step 4: Review the Quote¶
Check:
- Current price
- Percent change
- Volume
- Previous close
- 52-week range
- News headline
Step 5: Review the Chart¶
Check:
- Trend
- Volume
- EMA position
- Support/resistance
- Recent high and low
- Whether price is extended or consolidating
Step 6: Plan the Trade¶
Before clicking Buy, Sell, Short, or Cover, write down:
- Entry price
- Stop price
- Target price
- Share size
- Maximum loss
- Reason for the trade
Step 7: Place the Order¶
For practice, start with small paper quantities.
- Set quantity.
- Choose order type.
- Confirm time in force.
- Confirm ticker.
- Click the correct action button.
- Watch the trade log for status.
Step 8: Manage the Position¶
After entry:
- Confirm the order filled.
- Confirm the position appears correctly.
- Set or verify stop loss.
- Watch chart and Time & Sales.
- Exit according to the plan.
Step 9: Review the Trade Log¶
After the trade:
- Check fill price.
- Check exit price.
- Review whether the order type behaved as expected.
- Record what went right and what went wrong.
17. Example: Reading SOXS in the Screenshot¶
The screenshot shows SOXS selected.
Visible observations:
- SOXS is trading around $5.83.
- The quote panel shows a large negative percentage move.
- The 5-minute chart shows a sharp drop followed by sideways movement.
- Volume increased during the large move.
- EMA lines are near or above price after the drop.
- The account is in paper trading mode.
- There are no open positions shown in the paper trading panel.
- The trade log shows previous filled, pending, and cancelled trades.
A cautious interpretation: SOXS had a sharp move lower and is attempting to stabilize. A beginner should not assume an immediate reversal. Wait for a clear setup, defined risk, and confirmation.
18. Risk Management Checklist¶
Before every trade, confirm:
- Correct ticker
- Correct account mode
- Correct order type
- Correct quantity
- Correct price
- Correct time in force
- Stop loss planned
- Target planned
- Maximum loss known
- No unexpected open orders
- No unexpected open positions
- Spread is acceptable
- Volume is sufficient
19. Common Mistakes to Avoid¶
| Mistake | Why It Is Dangerous |
|---|---|
| Clicking Buy/Sell without checking ticker | You may trade the wrong symbol |
| Using market orders on wide spreads | You may get a bad fill |
| Forgetting to cancel pending orders | Old orders may execute unexpectedly |
| Confusing Sell and Short | You may open the wrong type of position |
| Confusing Cover and Buy | You may not close the intended position |
| Trading too large in paper mode | Builds bad habits |
| Ignoring Time & Sales | You may miss weak liquidity |
| Ignoring the trade log | You may not notice pending or cancelled orders |
| Trading without a stop | Loss can grow quickly |
| Relying only on scanner results | Scanner activity does not equal a good setup |
20. Practice Routine¶
Use this routine for learning DAS Pro safely.
- Start in paper trading mode.
- Pick one symbol.
- Review the quote panel.
- Check the 1D, 1H, 15m, and 5m charts.
- Mark support and resistance.
- Plan a paper trade.
- Enter with a small quantity.
- Set a stop.
- Exit according to your plan.
- Review the trade log.
- Write down one lesson from the trade.
Repeat this routine until the order-entry process feels natural.
21. Recommended Beginner Layout¶
A clean beginner layout should include:
| Panel | Recommended Purpose |
|---|---|
| Account & Metrics | Risk and account status |
| Paper Trading | Practice account and trade log |
| Montage | Order entry |
| Chart | Price action and trade planning |
| Quote | Symbol details and news |
| Time & Sales | Live trade activity |
| Custom Scanner | Find candidates after adding filters |
Keep the chart and montage visible at all times. Do not overcrowd the workspace with extra panels until you are comfortable.
22. Final Notes¶
The DAS Pro-style dashboard is designed for active trading, so it can move quickly. Learn slowly in paper trading mode.
Use the dashboard to:
- Check account status
- Build watchlists or scans
- Review quotes and news
- Study charts
- Place practice orders
- Track fills and cancellations
- Review trades after execution
A good rule: if you cannot explain what every button in the montage will do, do not use it with real money.