§02 CHARTS - Bar Replay¶
It allows traders to look back at past historical periods, slice away future data from a specific point in time, and "play back" price action bar-by-bar. This is an essential utility for backtesting trading strategies, practicing market execution in real-time simulations, and reviewing past setups.
How to Activate Bar Replay¶
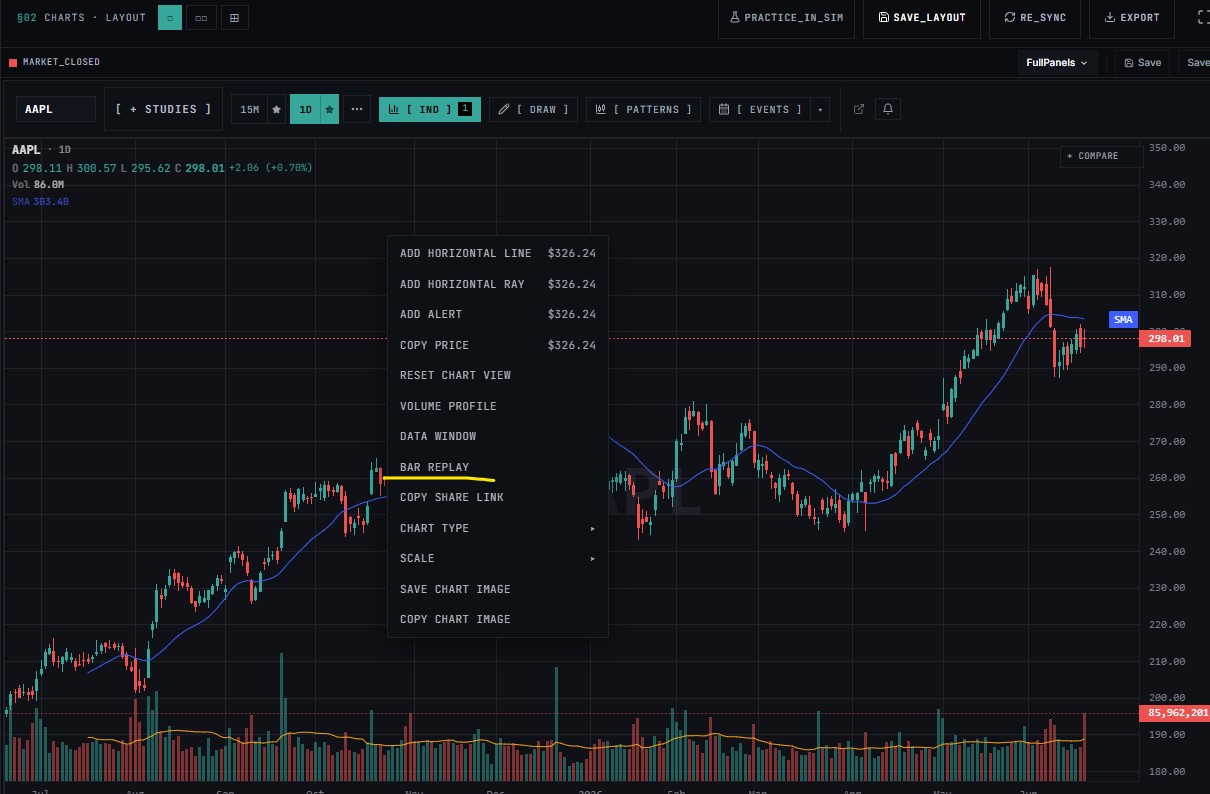
- Access the Context Menu: Right-click anywhere within the primary chart workspace area.
- Select Bar Replay: Locate BAR REPLAY from the vertical dropdown list (situated directly between Data Window and Copy Share Link).
- Initialize the Control Panel: Selecting this option slices the current chart perspective and opens the dedicated playback floating control panel at the bottom center of the workspace viewport.
The Bar Replay Interface & Controls¶
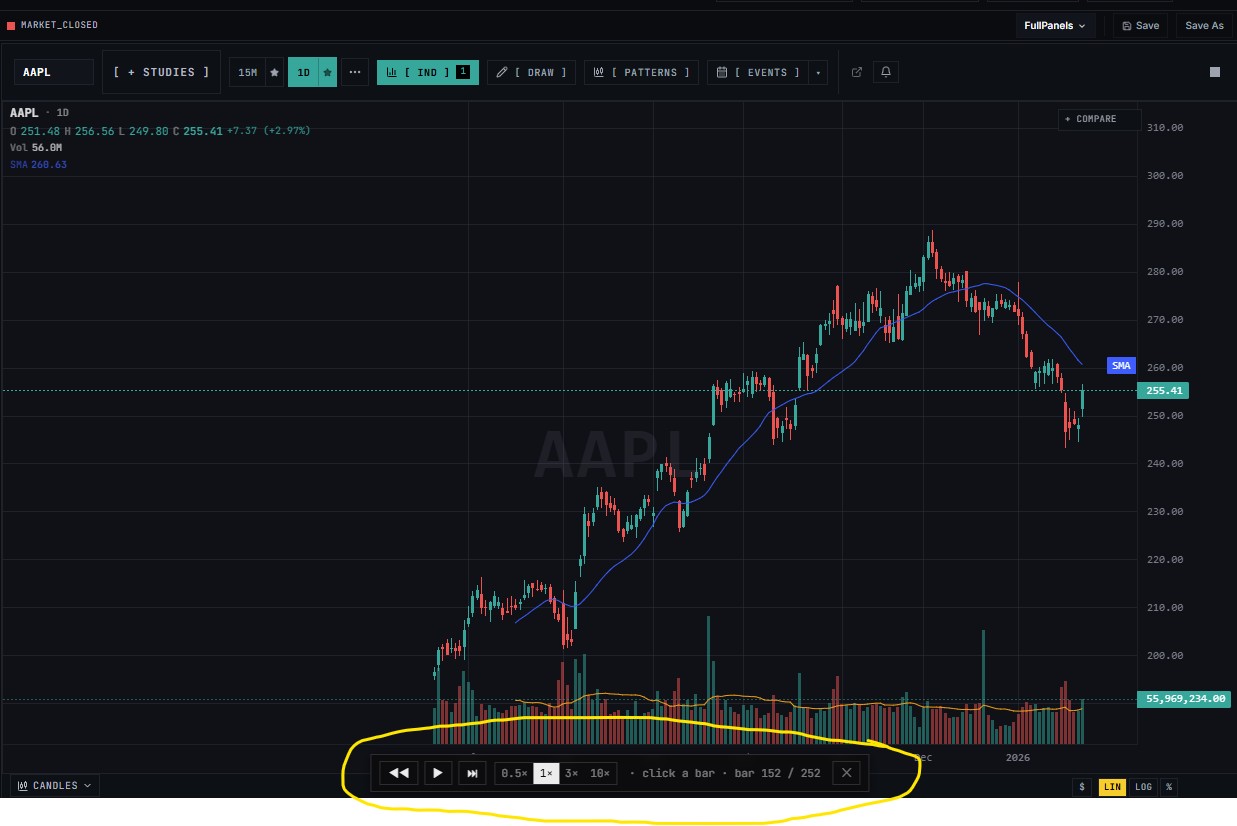
Once activated, a floating controller panel appears containing multiple specific media-style button groups, speed adjustments, and metadata readouts:
1. Playback Navigation Buttons¶
- Jump to Beginning / Rewind (
|◀): Rewinds the active simulation session back to the initially chosen historical starting point. - Play / Pause (
▶/‖): Toggles the continuous automatic rendering of historical bars. When playing, bars will print sequentially based on the selected playback speed. - Step Forward (
▶|): Prints exactly one single candlestick/bar at a time with each consecutive click, allowing for a precise, micro-level analysis of structural development.
2. Speed Adjustment Variables¶
The control bar provides multi-speed toggle constraints to control the speed of the automatic play loop:
0.5x: Half-speed slow motion for deep analysis of volatile, fast-moving structural formations.1x: The default standardized printing cadence (typically 1 bar per second or an assigned tick increment).3x: Accelerated printing to advance through extended consolidation boundaries or quiet market sessions quickly.10x: Maximum speed for rapidly rendering macroscopic visual structural developments.
3. Contextual Instructions & Counter State¶
click a bar: Actionable UI helper instructing the user to select the specific historical candle from which they want to cut the chart off and begin the simulation loop.bar 152 / 252: Live array index counter demonstrating the current frame location relative to the entire cached index block (e.g., viewing bar 152 out of a 252-unit dataset).
4. Close Mechanism¶
- Exit Button (
✕): Closes out the active replay environment state, restores the chart workspace viewport back to the live, real-time right-hand boundary edge, and closes out the lower panel asset controls.
Typical Use Cases for Technical Practitioners¶
- Historical Strategy Backtesting: Simulating historical trade executions without looking forward to future price developments, mitigating look-ahead bias.
- Market Structure Analysis: Isolating dynamic trend transitions, support/resistance breaks, or volume shelf developments bar-by-bar.
- Pattern Verification: Rewinding the chart before a major pattern breakdown or breakout to analyze the leading indicator states in a real-time layout format.