§02 CHARTS - Chart Type¶
Below is a detailed breakdown of the options available within this submenu and their typical use cases in technical analysis.
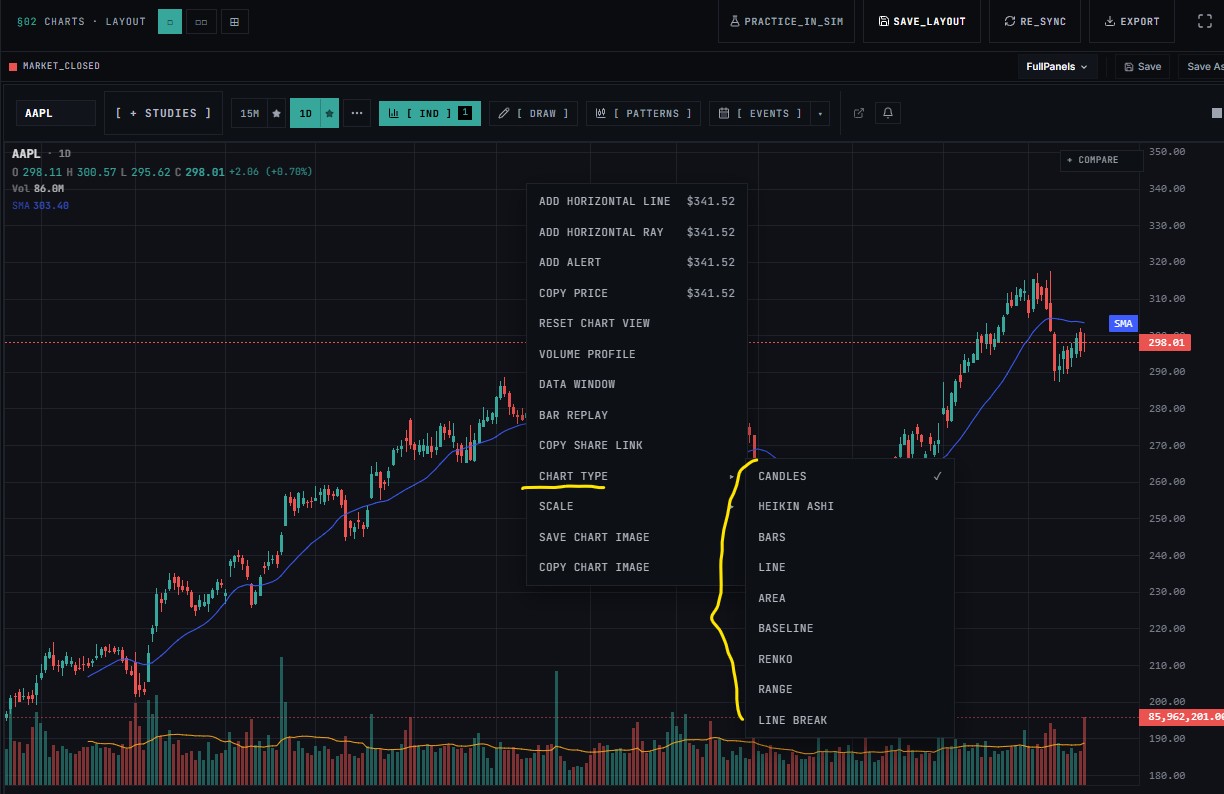
Submenu Structure¶
When a user right-clicks on the chart area or selects CHART TYPE, a nested dropdown list appears containing the following nine chart formatting options:
| Option | Type | Description / Standard Use Case |
|---|---|---|
| CANDLES | Standard | The active selection (indicated by the checkmark ✓). Displays open, high, low, and close (OHLC) prices for a specific period as boxes with wicks. |
| HEIKIN ASHI | Averaged | A modified candlestick style that averages price data to filter out market noise and highlight trends more clearly. |
| BARS | Standard | Often called OHLC bars. Displays price levels using vertical lines with horizontal ticks on the left (open) and right (close). |
| LINE | Simplified | Connects closing prices over time with a continuous line, offering a clean view of long-term price action and structural support/resistance. |
| AREA | Simplified | Similar to a line chart, but the space underneath the trend line is filled with a color or gradient to emphasize the magnitude of price movements. |
| BASELINE | Comparative | Plots price changes relative to a selected reference line (baseline), visually separating gains (above the line) from losses (below the line). |
| RENKO | Non-Time-Based | Built using bricks that represent a fixed price movement. A new brick is formed only when the price moves by a predefined amount, ignoring time. |
| RANGE | Non-Time-Based | Creates a new bar or candle only when the price movement spans a specific specified distance or range, filtering out tight consolidations. |
| LINE BREAK | Non-Time-Based | Draws vertical blocks based on the comparison of closing prices. A new block is added only when the current close breaks the high/low of a set number of prior lines. |