§02 CHARTS - Data Windows¶
The Data Window is an informational overlay panel within the charting interface that provides detailed metrics for a selected asset at a specific point in time (or the latest available data point).
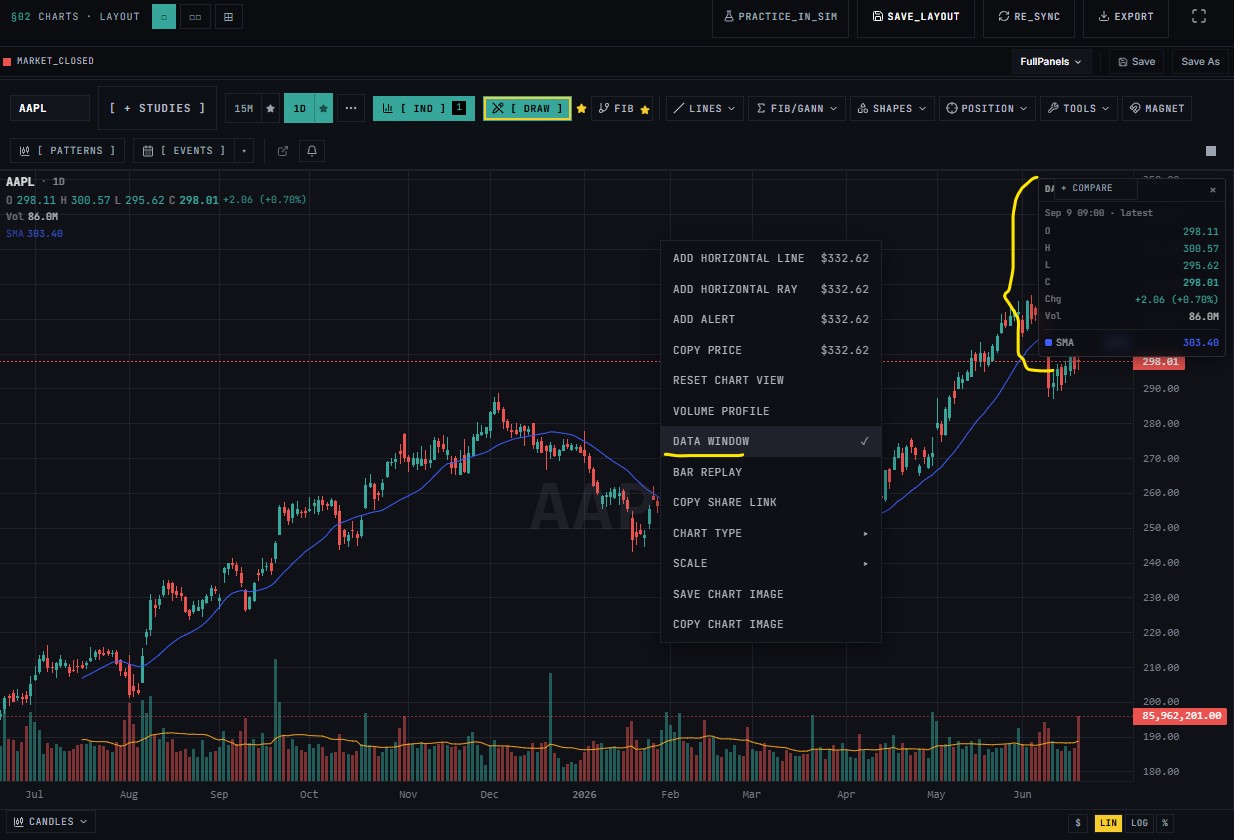
Based on the provided chart interface, the Data Window contains the following information:
Header Section¶
- Title:
DATA + COMPARE(with a close/minimize action option). - Timestamp: Displays the specific date and time for the selected candle or data point (e.g.,
Sep 9 09:00 - Latest).
Price Metrics¶
- O (Open): The opening price of the asset for the selected period (e.g.,
298.11). - H (High): The highest price reached during the period (e.g.,
300.57). - L (Low): The lowest price reached during the period (e.g.,
295.62). - C (Close): The closing or current price of the period (e.g.,
298.01).
Performance & Volume¶
- Chg (Change): The absolute and percentage change in price relative to the previous period (e.g.,
+2.86 (+0.70%), highlighted in green indicating a positive gain). - Vol (Volume): The total volume of shares or contracts traded during the period (e.g.,
86.0M).
Technical Indicators¶
- SMA (Simple Moving Average): Displays the current value of the Simple Moving Average overlay line (e.g.,
303.40, color-coded to match the blue indicator line on the chart).